
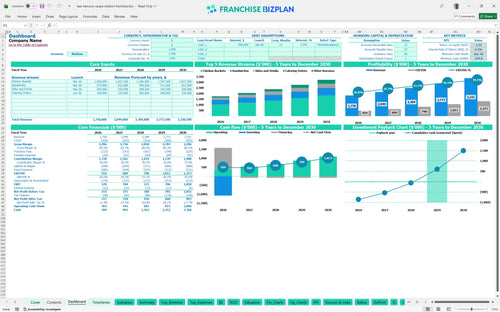
All-in-one Dashboard
Core inputs and core outputs


This franchise unit business plan includes a comprehensive financial evaluation tool for prospective franchisees to project P&L, cash flow, and ROI.
Core inputs and core outputs
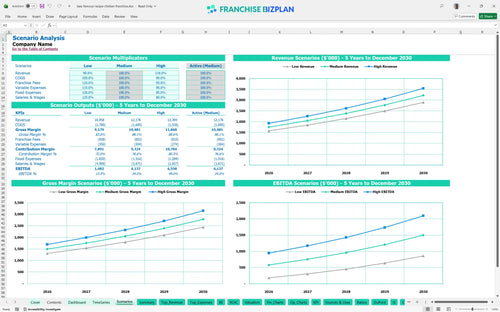
Three scenario analysis
Presentation ready
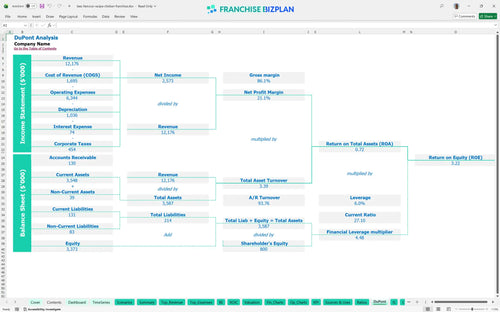
DuPont analysis
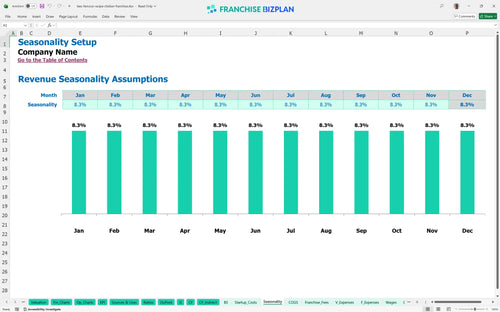
Researched revenue assumptions
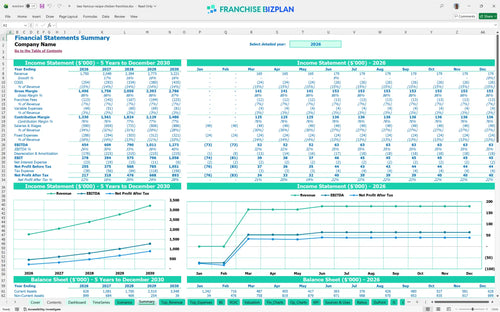
Lender-friendly financial outputs
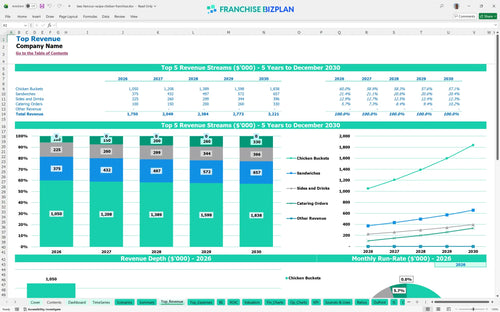
Revenue stream detailed view
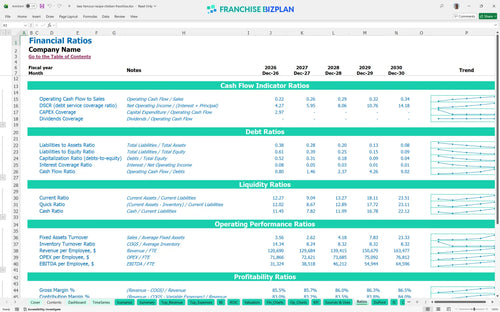
Performance metrics benchmark
We built this franchise unit financial model using our own research to provide a realistic view of store performance. Key assumptions like the $1.75M year-one revenue, 5% royalty fees, and $1,075,000 in total CAPEX are pre-populated with researched data specific to Lee's Famous Recipe Chicken Franchise franchise unit and are fully editable. This tool helps you move beyond the brochure and into the real numbers of chicken franchise ownership.
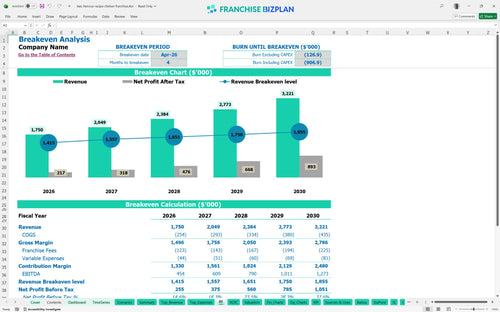
This chicken franchise unit is projected to hit its monthly breakeven by April 2026, just four months after launching. You will defintely need to manage the 13% protein cost and 5% royalty burden to maintain the $454,000 year-one EBITDA. Net profitability is achievable early if you execute the high-throughput drive-thru model correctly.
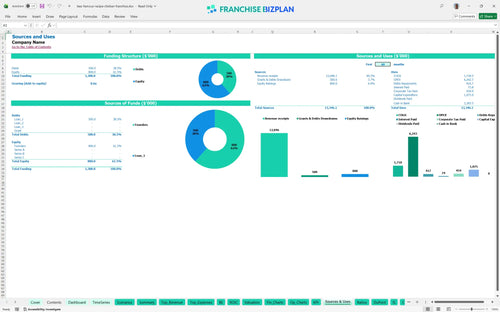
You need approximately $1,075,000 to launch this unit, covering everything from the $35,000 franchise fee to the $450,000 leasehold build-out. This fast food franchise investment calculator also accounts for $220,000 in kitchen equipment and a $150,000 drive-thru setup. Your minimum cash point hits $235,000 in June 2026, so liquidity is vital.
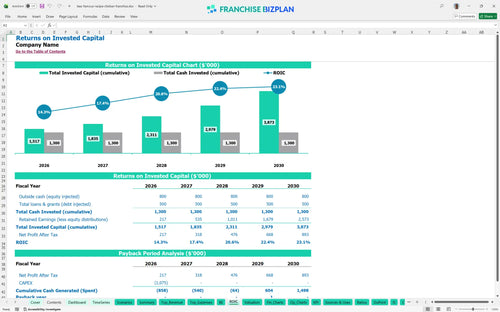
Investors can expect a 4.26% IRR and a full payback on the initial investment within 4 years. With an average net margin that supports a 3.22 return on equity, the model shows steady wealth creation as revenue climbs toward $3.2M. Analyzing franchise profitability and roi is simpler when you see the five-year cash-on-cash return. Long-term value sits in the consistent EBITDA growth.
The monthly breakeven point is reached when revenue covers the $16,000 rent and $22,400 in monthly management salaries. Estimating revenue for a fast food drive-thru franchise shows that throughput is the biggest lever for hitting this goal by month four. If labor costs exceed the 30% range, your breakeven timeline will slide. Speed at the window is your best friend here.
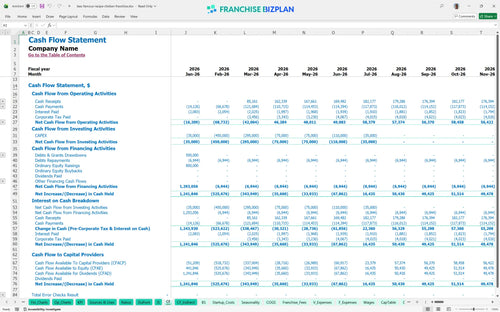
The lowest cash point is $235,000 in June 2026, meaning you have a solid buffer if you start with the recommended capital. This restaurant unit profit and loss projection suggests keeping at least three months of operating expenses in reserve during the ramp-up. If the catering launch is delayed, your cash runway will tighten quickly. Watch the timing of your $75,000 furniture and fixtures spend.
A 10% drop in revenue in the Low scenario delays the 4-year payback and increases the peak cash need significantly. Conversely, the High scenario shows that hitting $2M+ in year two drastically improves the 4.26% IRR. This excel template for restaurant franchise financial planning lets you stress-test how a 1-point shift in COGS affects your year-one margin. Scenarios help you prepare for the worst while aiming for the best.
This franchise financial model template is built in Excel with fully editable assumptions and pre-filled formulas. You can adjust the revenue drivers, staffing levels, and local rent costs to match your specific territory and site selection. This flexibility lets you move from a high-level estimate to a precise store-level margin analysis in minutes. Every cell is open, so you control the logic.

Our restaurant financial forecasting template provides a detailed five-year outlook for your unit or small chain. It tracks revenue scaling from $1.75M in year one to over $3.2M by year five, accounting for organic growth and catering expansion. You get a clear view of long-term cash flow and the balance sheet to support multi-unit planning. Growth requires a map, and this is it.

Operating a franchise means managing ongoing obligations like franchise royalty payments and brand fund contributions. This model automatically calculates the 5% royalty and 2% marketing fee against your gross sales, ensuring you see the true net profit after all brand costs. It simplifies the math of your franchise disclosure document analysis. Knowing your real take-home pay starts with accurate fee tracking.

This restaurant startup costs spreadsheet helps you quantify the total initial investment, from leasehold improvements to the initial franchise fee. It includes a detailed breakeven analysis to identify the exact sales volume needed to cover your $16,000 monthly rent and other fixed overhead. You will know exactly when the unit stops burning cash. Precision in the pre-opening phase prevents mid-ramp surprises.

The model incorporates unit-level economics and industry benchmarks to help you sanity-check your operating profit margin. By comparing your projected labor and food costs against typical chicken franchise standards, you can identify potential margin leaks before they happen. It turns abstract goals into concrete operational targets for your manager. Benchmarking is the difference between guessing and governing.


Simply purchase and download the financial model template, then access it instantly using Microsoft Excel or Google Sheets. No installation or technical expertise required-just open and start working.

Enter your business-specific numbers, including revenue projections, costs, and investment details. The pre-built formulas will automatically calculate financial insights, saving you time and effort.

Leverage the investor-ready format to confidently showcase your financial projections to banks, franchise representatives, or investors. Impress stakeholders with clear, data-driven insights and professional reports.

Leverage the investor-ready format to confidently present your projections to banks, franchise representatives, or investors.