


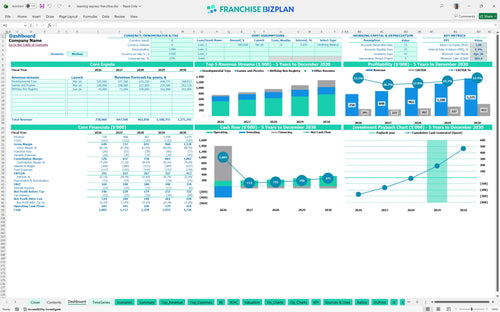
All-in-one Dashboard
Core inputs and core outputs



This franchise unit financial forecasting spreadsheet includes integrated income statements, cash flow tracking, and startup cost calculators designed specifically for toy retail operations.
Core inputs and core outputs
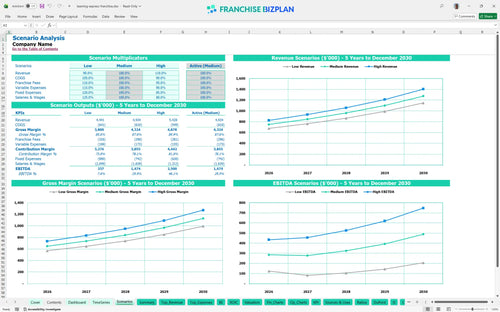
Three scenario analysis
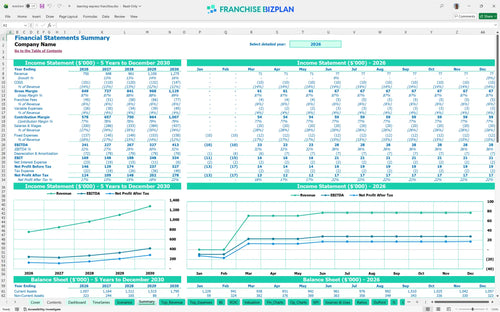
Presentation ready
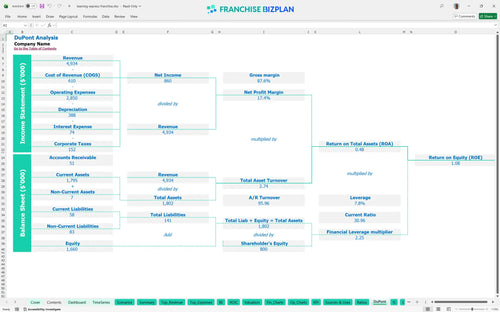
DuPont analysis
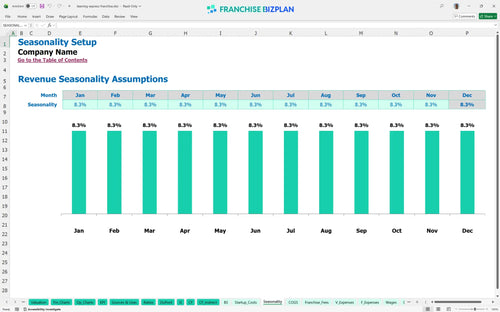
Researched revenue assumptions
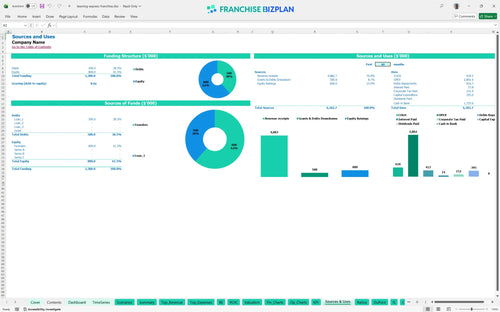
Lender-friendly financial outputs
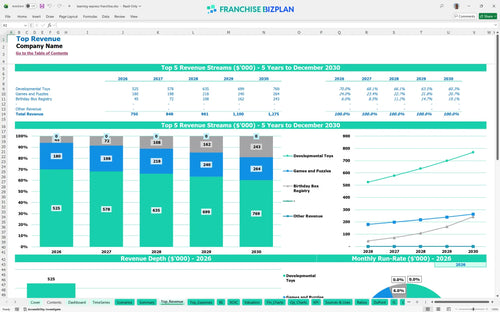
Revenue stream detailed view
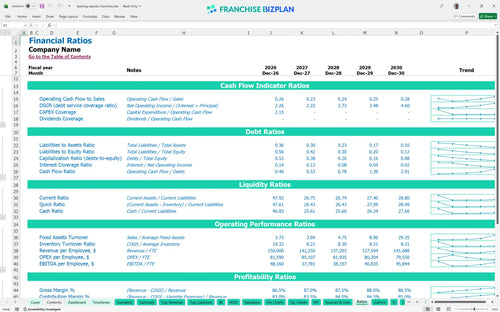
Performance metrics benchmark
We built this franchise unit financial model based on deep research into toy retail unit economics and brand standards. The pre-populated data includes realistic revenue streams like the Birthday Box Registry and essential costs like Toy Expert staffing, all of which you can edit. With a projected Year 1 EBITDA of $241,000 and a 4-year payback period, this model provides the data-driven clarity needed for a confident investment decision.
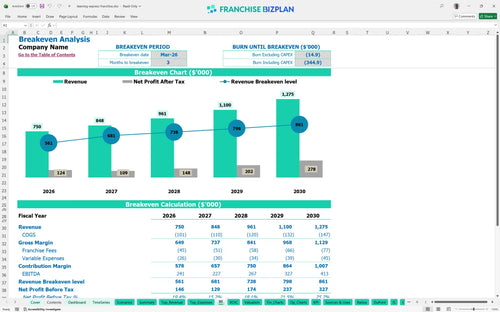
This unit is designed to hit its stride quickly, reaching its break-even date by March 2026, just three months after launch. While Year 1 EBITDA starts strong at $241,000, the model shows a slight dip in Year 2 before scaling to $413,000 by Year 5 as the Birthday Box Registry matures and inventory costs drop to 10.5%.
You will need approximately $395,000 in total initial investment to get the doors open. This covers the $35,000 franchise fee, $180,000 for leasehold improvements, and $60,000 for fixtures. The model also accounts for a $25,000 POS and security system to ensure operations are secure from day one.
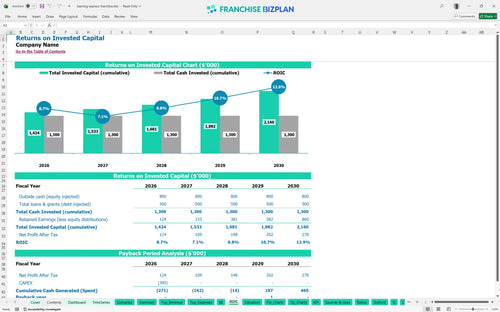
The ROI analysis for franchises shows a 4-year payback period and an Internal Rate of Return (IRR) of 4.33%. While the IRR appears conservative, the Return on Equity (ROE) of 1.08 indicates a stable long-term asset. This retail franchise profit and loss projection assumes steady growth in average ticket size through concierge services.
The unit reaches break-even in month 3, requiring enough monthly revenue to cover $8,500 in rent and roughly $14,000 in base payroll. Rent is the primary fixed cost driver, meaning site selection is the most critical factor in your franchise business model financial feasibility study.
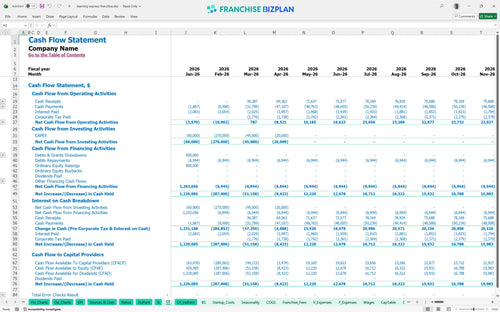
Your lowest cash point is projected for April 2026 at $882,000, which includes your initial capital injection and operating reserves. The model suggests a 3-month runway is sufficient given the quick break-even, but we defintely recommend keeping a buffer for seasonal inventory spikes.
Moving from a Medium to a High scenario significantly accelerates the $1.27M revenue target, potentially shortening the 4-year payback. A Low scenario, where Year 1 sales fall below $750,000, would put immediate pressure on the $8,500 monthly rent obligation and require tighter labor management to maintain store-level margin.
Finance: update unit break-even and payback model by Friday.
This franchise financial model is built in Excel with open formulas, allowing you to tweak every variable from local labor rates to specific lease terms. You can adjust the pre-filled assumptions to match your exact territory, ensuring the retail franchise financial projections reflect your local market reality rather than just a corporate average.

Planning for a toy store requires a long-term view of inventory cycles and seasonal peaks. This tool provides a detailed 5-year outlook, mapping out how revenue scales from $750,000 in Year 1 to over $1.27 million by Year 5. It includes a full franchise cash flow statement to help you manage liquidity during growth phases.

Understanding franchise fee and royalty structures is critical for protecting your store-level margin. The model automatically calculates the 5% royalty and 1% marketing fund contributions based on your monthly sales forecasts. This ensures you see the exact impact of these off-the-top costs before you even sign a lease.

Launching a retail location involves significant upfront capital, from the $35,000 initial fee to $180,000 in leasehold improvements. This tool helps you perform a franchise profitability analysis by calculating the exact sales volume needed to cover your $8,500 monthly rent and other fixed costs. It simplifies how to calculate startup costs for a retail franchise without missing hidden line items.

We have integrated retail operating expenses benchmarks to help you validate your budget against industry standards. Whether you are looking at product inventory costs starting at 12.5% or payment processing fees at 2.5%, these markers act as a sanity check. This financial planning for new retail franchise owners ensures your projections stay grounded in operational reality.


Simply purchase and download the financial model template, then access it instantly using Microsoft Excel or Google Sheets. No installation or technical expertise required-just open and start working.

Enter your business-specific numbers, including revenue projections, costs, and investment details. The pre-built formulas will automatically calculate financial insights, saving you time and effort.

Leverage the investor-ready format to confidently showcase your financial projections to banks, franchise representatives, or investors. Impress stakeholders with clear, data-driven insights and professional reports.

Leverage the investor-ready format to confidently present your projections to banks, franchise representatives, or investors.