
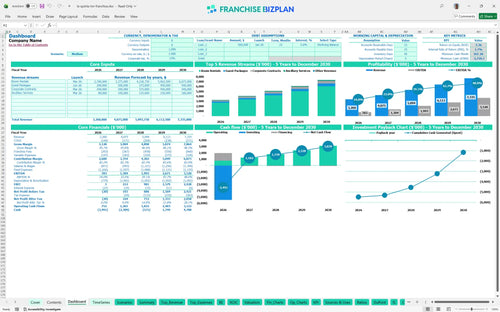
All-in-one Dashboard
Core inputs and core outputs


This franchise unit financial model template provides a comprehensive roadmap for estimating hotel franchise operating expenses and projecting long-term ROI for a single unit or territory.
Core inputs and core outputs
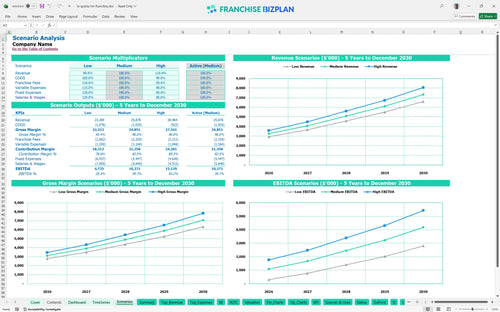
Three scenario analysis
Presentation ready
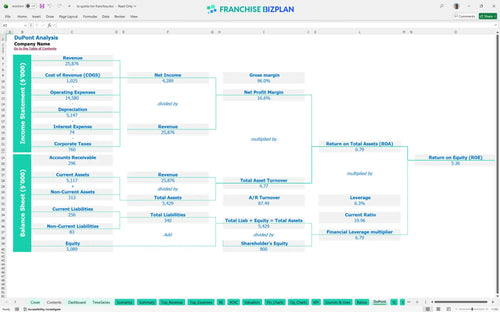
DuPont analysis
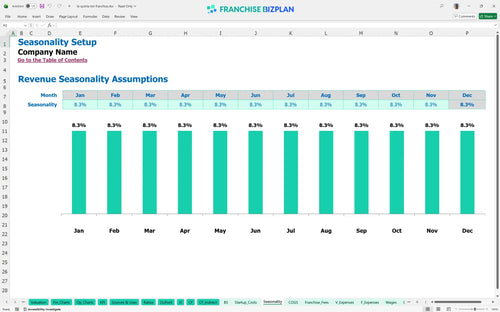
Researched revenue assumptions
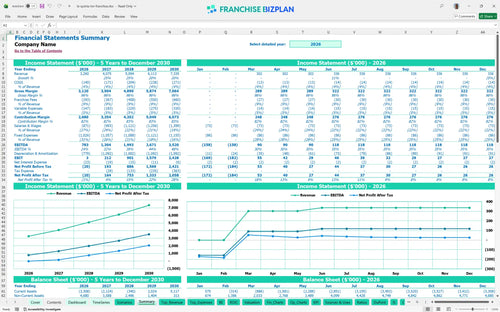
Lender-friendly financial outputs
Revenue stream detailed view
Performance metrics benchmark
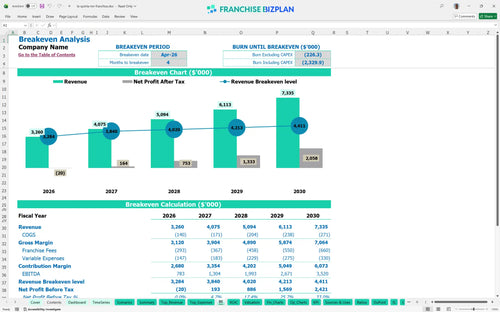
We built this franchise unit financial model using our own research on mid-scale hotel performance. Key assumptions like the $59,950 franchise fee and the 9% total brand fees are pre-populated with researched data but remain fully editable. Based on the data, the unit hits monthly breakeven in April 2026, just 4 months after launch, though full payback on the heavy $5.4M+ initial investment takes longer than five years.
The unit becomes profitable on a monthly basis in April 2026. Here's the quick math: by year two, EBITDA reaches $1,304,000 after accounting for the 4.5% royalty and 4.5% marketing fund contributions. This is defintely a high-volume model where margin depends on keeping continental breakfast costs near 2.1%.
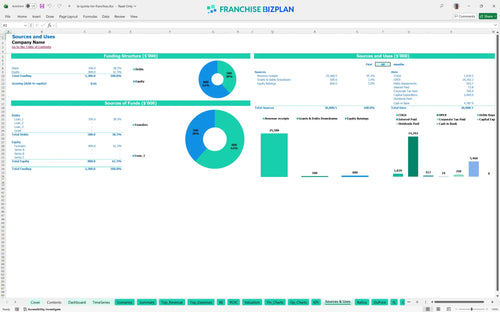
You will need significant capital to launch this unit in the US, with a total initial investment exceeding $5.4 million. This includes the $59,950 franchise fee and $3,000,000 for leasehold improvements, plus a cash buffer to handle the $3,711,000 minimum cash requirement during the ramp-up phase.
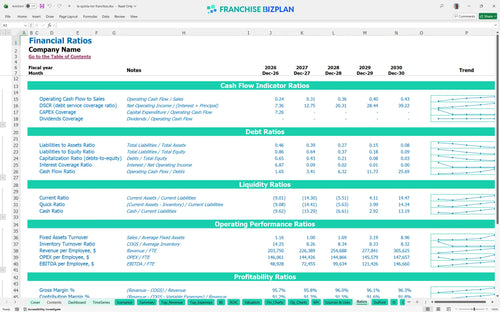
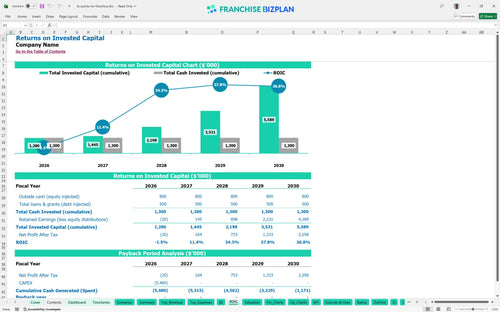
This is a long-term infrastructure play with an Internal Rate of Return (IRR) of 1.7% and a Return on Equity (ROE) of 5.36%. While the cash flow is strong by year 5 at $3,520,000 EBITDA, the high initial entry cost means you won't see full payback within the first five years of operation.
The unit reaches its break-even point in April 2026, roughly 4 months after opening. To stay above water, you must manage the $45,000 monthly rent and $15,000 utility burden, as occupancy and average daily rate are the primary drivers for covering these fixed costs.
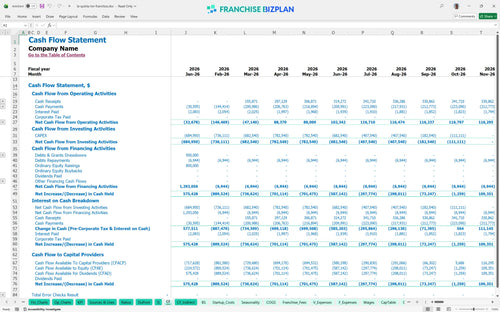
Your lowest cash point hits in October 2026 at negative $3,711,000, meaning you need robust financing before the unit stabilizes. What this estimate hides is the timing gap between the $1,000,000 FF&E spend and the ramp-up of corporate contract revenue.
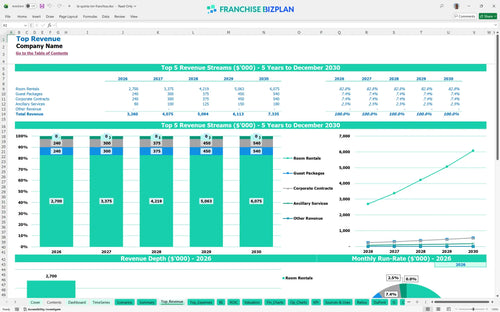
Small shifts in room rates or occupancy can swing the year-1 $783,000 EBITDA significantly. A high-performance scenario focuses on hitting the $4,050,000 room rental target by year 5, which drastically improves the 1.7% IRR and helps the unit reach peak cash sooner.
This hotel franchise financial model is a flexible Excel tool designed for mid-scale hospitality assets. You can adjust room rates, occupancy assumptions, and staffing levels to match your specific market, whether you are near an airport or a downtown hub, making it easy to adapt to any operating scenario.

Planning for a hotel requires a multi-year view to account for ramp-up and stabilization. This model provides a full 5-year outlook, showing revenue growing from $3,260,000 in the first year to over $7,335,000 by year five, allowing for detailed hospitality ROI analysis.

Brand costs are a significant line item in any hospitality franchise investment analysis. We have baked in a 4.5% royalty and a 4.5% marketing fee to ensure you see the true net cash flow after the franchisor takes their cut from your gross room rentals.

Launching a hotel involves massive upfront capital, like the $3,000,000 for leasehold improvements and $1,000,000 for FF&E. This hotel startup cost calculator helps you find the exact month you stop burning cash and start generating profit based on your fixed and variable costs.

Don't guess your operating margins; use our built-in benchmarks to see if your 2.5% breakfast cost or 3.4% reservation commission is in line with the market. This franchise profitability Excel template ensures your pro forma stays realistic compared to other mid-scale operators.


Simply purchase and download the financial model template, then access it instantly using Microsoft Excel or Google Sheets. No installation or technical expertise required-just open and start working.

Enter your business-specific numbers, including revenue projections, costs, and investment details. The pre-built formulas will automatically calculate financial insights, saving you time and effort.

Leverage the investor-ready format to confidently showcase your financial projections to banks, franchise representatives, or investors. Impress stakeholders with clear, data-driven insights and professional reports.

Leverage the investor-ready format to confidently present your projections to banks, franchise representatives, or investors.