
All-in-one Dashboard
Core inputs and core outputs


This Excel template for restaurant franchise unit performance includes integrated financial statements, CAPEX schedules, and detailed payroll calculators to give you a professional-grade view of your business. It is a complete toolkit for a serious operator.
Core inputs and core outputs
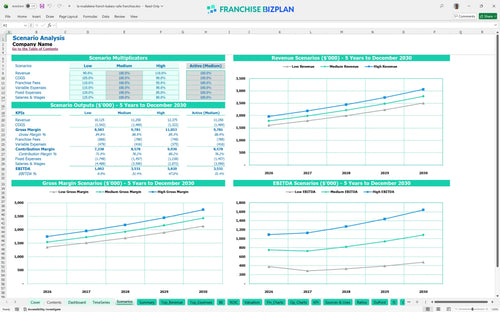
Three scenario analysis
Presentation ready
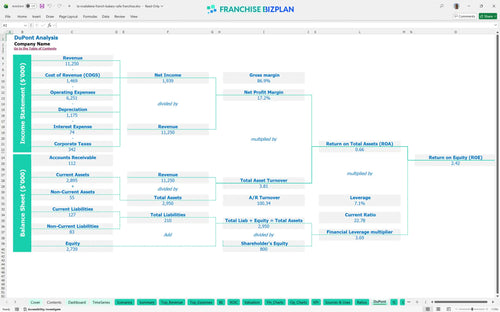
DuPont analysis
Researched revenue assumptions
Lender-friendly financial outputs
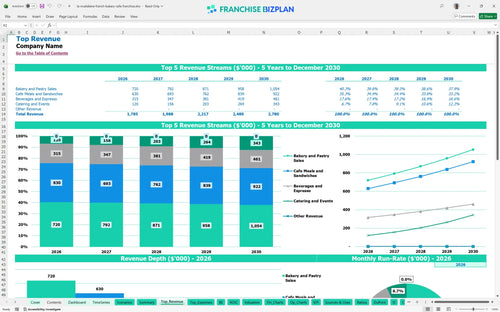
Revenue stream detailed view
Performance metrics benchmark
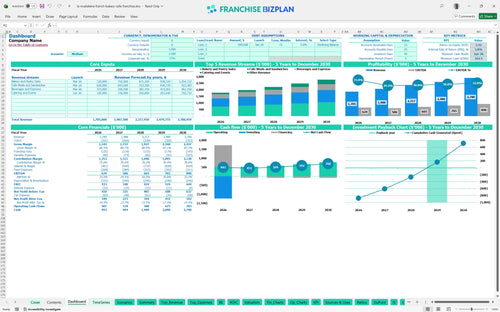
We built this franchise unit financial model using our own research to help you navigate the cafe franchise startup costs. Key assumptions like the $1,785,000 Year 1 revenue and $624,000 EBITDA are pre-populated with researched data specific to this French bakery and cafe franchise unit and are fully editable. This tool provides a clear path for anyone analyzing store-level performance.
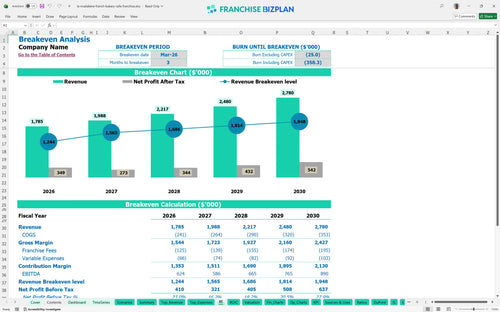
This unit reaches its break-even date in March 2026, just three months after the launch. The profit and loss statement accounts for food ingredients starting at 11% and the $16,500 monthly rent to show when you actually start keeping the cash. Speed to profit is the ultimate unit metric.
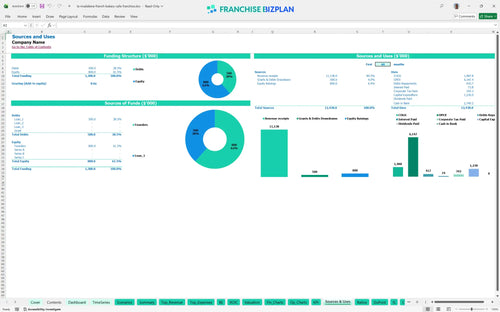
To launch this unit in the US, you need to know how to calculate startup costs for a bakery franchise properly. The total initial investment includes a $40,000 franchise fee, $550,000 for leasehold improvements, and $220,000 for bakery equipment, plus a $163,000 opening cash buffer. Capital expenditure planning is the foundation of your first year.
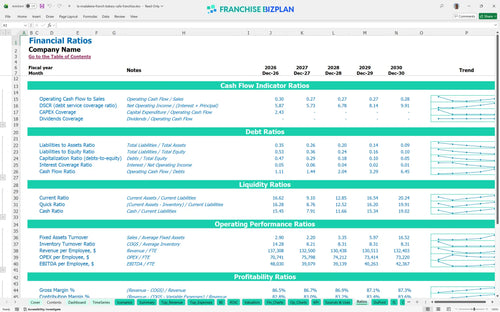
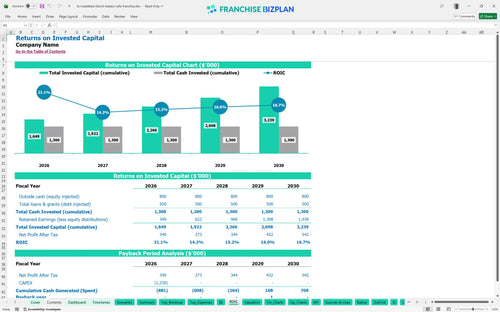
When analyzing return on investment for a food service franchise, this model shows an Internal Rate of Return (IRR) of 3.8% and a Return on Equity (ROE) of 2.42. The years to payback is estimated at 4, which is typical for financial planning for upscale restaurant franchises with high-end build-outs. ROI is why you are in this business.
Estimating profitability for a fast-casual cafe franchise requires knowing your monthly floor. The unit hits break-even in 3 months by balancing the $21,200 in basic monthly fixed expenses against high-margin bakery and pastry sales. Break-even is the first major milestone.
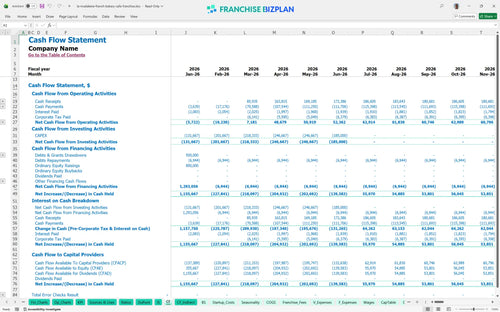
The franchise unit operating expense tracker shows the lowest cash point at $163,000 in June 2026. Budgeting for a new bakery franchise location requires this buffer to handle the timing gap between opening costs and mature-unit performance, which is defintely critical. Cash is the only thing that keeps the lights on.
A bakery and cafe franchise financial feasibility study must account for volatility. This model lets you compare Low, Medium, and High scenarios, showing how projecting revenue for a French bakery franchise changes if catering or beverage sales over-perform. Scenarios prepare you for the real world.
Finance: update unit break-even and payback model by Friday
This franchise financial model template is fully customizable in Excel, giving you total control over the numbers. It features pre-filled formulas and editable assumptions that make it easy to adapt to a specific location, local labor rates, and your unique operating scenario. Every assumption is yours to change.

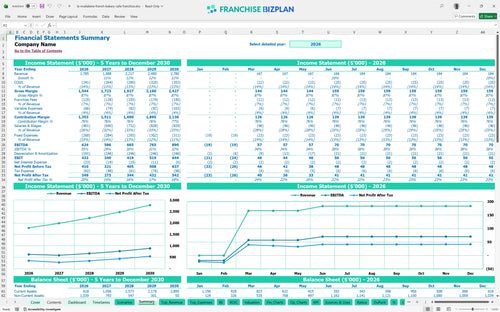
Success requires looking past the grand opening, which is why a solid restaurant franchise business plan needs a multi-year outlook. This model provides detailed 5-year revenue, cost, cash flow, and profit projections tailored for a single unit or a growing multi-unit chain. Five years of data beats one year of guessing.

The model captures the specific financial obligations that define franchise unit economics, including the initial $40,000 fee and ongoing 5% royalty payments. It also tracks the 2% brand marketing fund contribution so you can see the real margin left after the franchisor takes their cut. Royalties are a top-line reality you can't ignore.

Use this bakery franchise investment calculator to estimate your total initial investment, from the $550,000 leasehold improvements to the $110,000 fireplace installation. The break-even analysis helps you identify the exact sales level required to cover fixed monthly costs like the $16,500 rent. Knowing your number changes how you sleep at night.

The model incorporates built-in benchmarks for key metrics like food ingredients and labor costs to ensure your franchise unit financial projections are realistic. You can easily compare your expected performance against typical ranges for upscale fast-casual concepts to ensure your plan is solid. Benchmarks keep your projections from floating away.


Simply purchase and download the financial model template, then access it instantly using Microsoft Excel or Google Sheets. No installation or technical expertise required-just open and start working.

Enter your business-specific numbers, including revenue projections, costs, and investment details. The pre-built formulas will automatically calculate financial insights, saving you time and effort.

Leverage the investor-ready format to confidently showcase your financial projections to banks, franchise representatives, or investors. Impress stakeholders with clear, data-driven insights and professional reports.

Leverage the investor-ready format to confidently present your projections to banks, franchise representatives, or investors.