
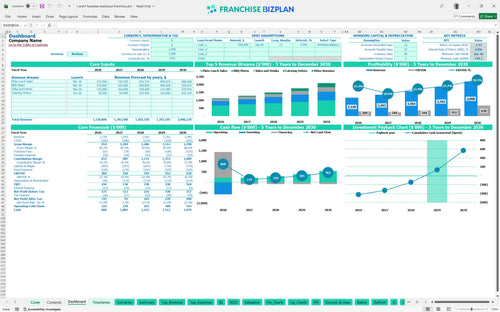
All-in-one Dashboard
Core inputs and core outputs


The franchise store financial feasibility spreadsheet includes a complete revenue forecasting engine, automated payroll calculators, and a return on investment calculation for restaurant franchise operators.
Core inputs and core outputs
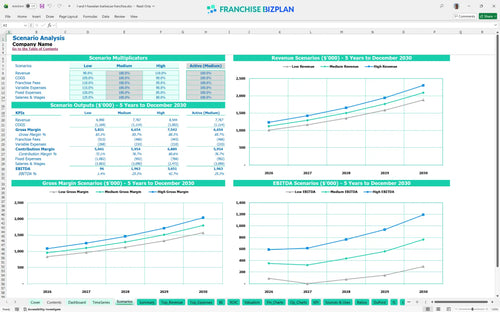
Three scenario analysis
Presentation ready
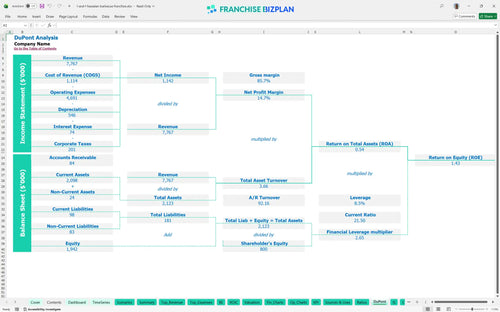
DuPont analysis
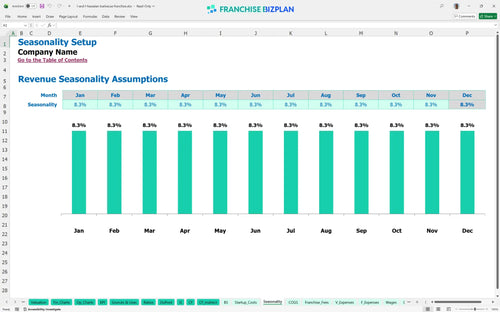
Researched revenue assumptions
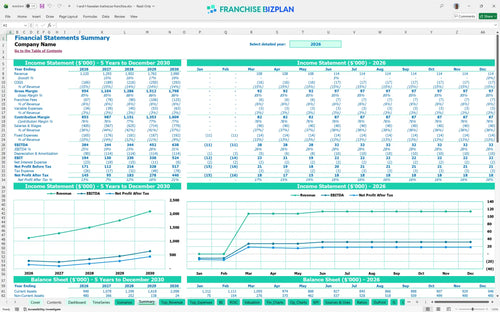
Lender-friendly financial outputs
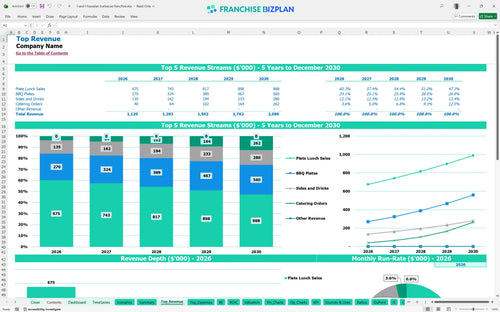
Revenue stream detailed view
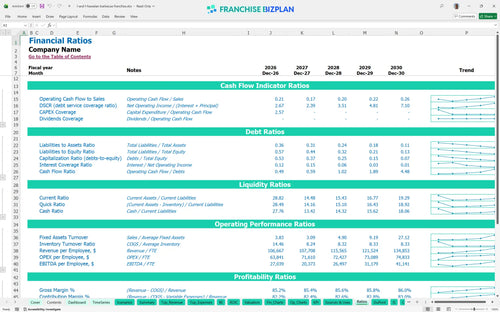
Performance metrics benchmark
We built this franchise unit financial model using our own research to help you navigate the restaurant franchise investment analysis. Key assumptions like the $1.12M year-one revenue and the 4% royalty fee are pre-populated with researched data and are fully editable to match your specific location. This tool ensures your budgeting for a new franchise unit opening is grounded in real-world numbers, not just brand marketing.
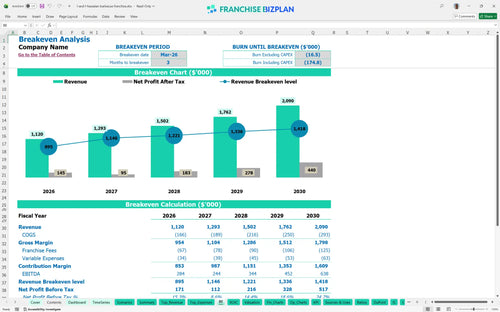
Based on the year-one EBITDA of $284,000 and the 3-month break-even analysis, this unit reaches profitability by March 2026. The model accounts for food ingredients starting at 13% of sales and a total labor spend for a full crew, showing a clear path to $638,000 EBITDA by year five as you optimize the restaurant franchise catering revenue model.
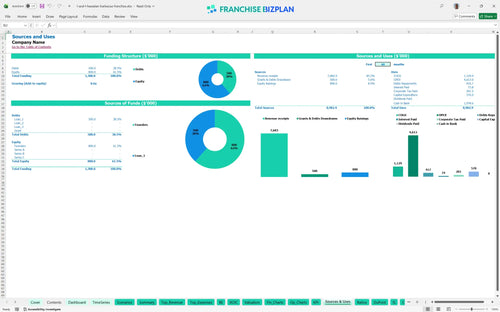
Launching this unit requires a total initial investment of approximately $570,000, covering the $35,000 franchise fee and $250,000 in leasehold improvements. This startup cost breakdown for fast-casual food franchise operations ensures you have enough capital for the $120,000 kitchen equipment package and the $45,000 POS system before the doors defintely open.
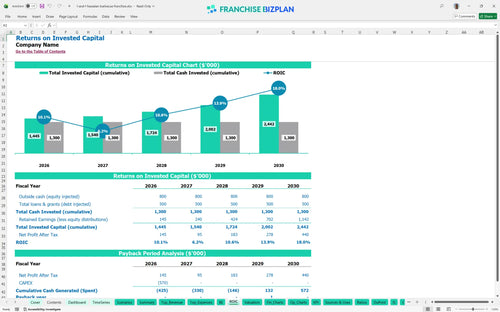
The return on investment calculation for restaurant franchise owners shows a 4-year payback period and an internal rate of return (IRR) of 3.97%. While the IRR is conservative, the return on equity (ROE) of 1.43 indicates steady wealth building, especially as revenue scales from $1.12M to over $2M by year five.
The break-even analysis shows you must clear a monthly fixed cost hurdle of roughly $13,500, which includes $9,000 for prime location rent and $2,000 for utilities. Your primary lever for reaching this point faster is throughput, specifically managing the $68,000 store manager and $55,000 assistant manager salaries against early foot traffic.
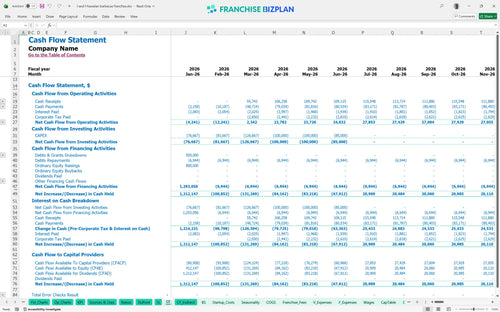
Your lowest cash point occurs in June 2026 at $745,000, which includes your initial capital and operating reserves. This Excel template for restaurant franchise financial projections suggests a healthy buffer, but you must monitor the timing of the $250,000 build-out payments to avoid unexpected working capital pressure during the ramp-up.
Comparing high and low scenarios shows how a 10% swing in revenue shifts the $284,000 year-one EBITDA significantly. This financial planning for multi-unit franchise operators allows you to stress-test how 4% franchise royalty fees and 2% marketing funds impact the bottom line when local labor costs or delivery fees spike.
Finance: update unit break-even and payback model by Friday
This franchise unit financial model is built in Excel with fully editable assumptions and pre-filled formulas, allowing you to adapt the projections to any specific territory or operating scenario. You can adjust everything from local labor rates to specific rent costs, ensuring the restaurant franchise business plan reflects your actual market conditions rather than generic estimates.

Plan for long-term growth with a detailed 5-year revenue and cash flow roadmap tailored for a fast-casual restaurant unit profitability model. The model tracks the transition from the initial $1.12M year-one revenue to a mature $2.09M in year five, providing a clear view of how store-level margins evolve as you scale operations and optimize throughput.

This tool captures the specific financial obligations of the brand, including the initial $35,000 fee and the ongoing 4% franchise royalty fees. By integrating the 2% marketing fund contribution directly into the monthly profit and loss, you can see the real impact of these top-line deductions on your net store-level EBITDA.

Estimate your total initial investment with a detailed startup cost breakdown for fast-casual food franchise units, covering build-out, equipment, and working capital. The integrated break-even analysis helps you identify the exact monthly sales volume required to cover your $13,500 in fixed monthly overhead, including rent and insurance.

The model incorporates industry-standard benchmarks for labor, food costs, and occupancy to help you sanity-check your projections. By comparing your 13% food ingredient cost and staffing levels against typical fast-casual ranges, you can identify potential margin leaks before they impact your bottom line.


Simply purchase and download the financial model template, then access it instantly using Microsoft Excel or Google Sheets. No installation or technical expertise required-just open and start working.

Enter your business-specific numbers, including revenue projections, costs, and investment details. The pre-built formulas will automatically calculate financial insights, saving you time and effort.

Leverage the investor-ready format to confidently showcase your financial projections to banks, franchise representatives, or investors. Impress stakeholders with clear, data-driven insights and professional reports.

Leverage the investor-ready format to confidently present your projections to banks, franchise representatives, or investors.