
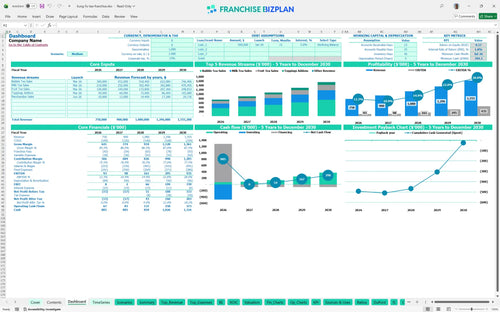
All-in-one Dashboard
Core inputs and core outputs


This franchise unit financial model template provides a complete roadmap for analyzing startup costs, monthly operations, and five-year growth for a single retail location. This is the full blueprint for your beverage unit.
Core inputs and core outputs
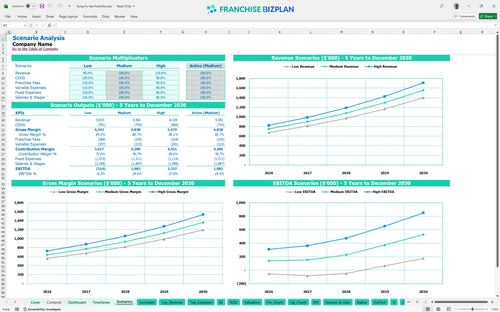
Three scenario analysis
Presentation ready
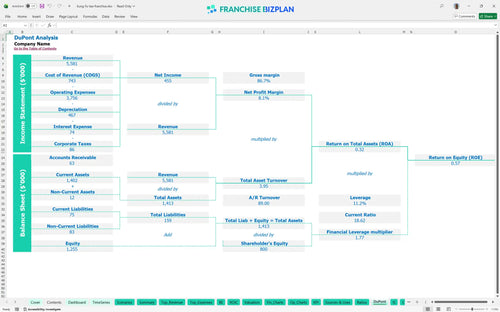
DuPont analysis
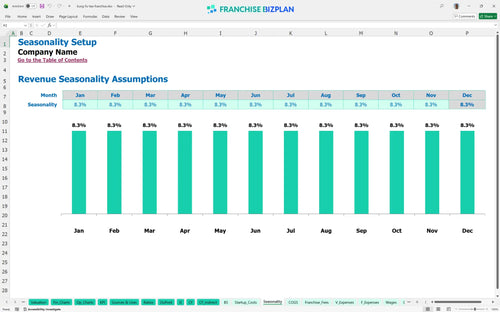
Researched revenue assumptions
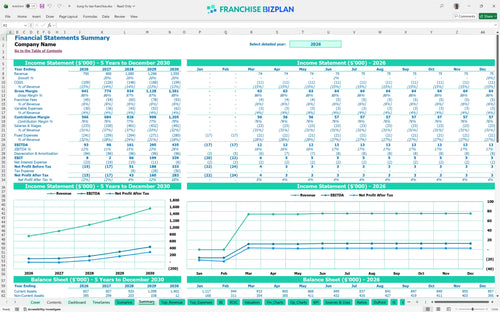
Lender-friendly financial outputs
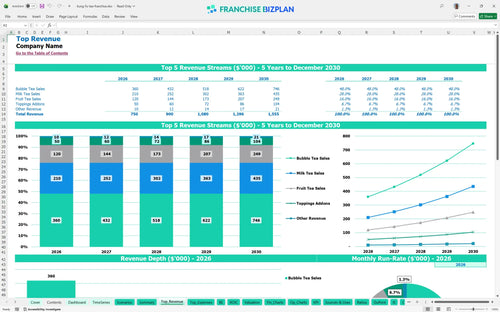
Revenue stream detailed view
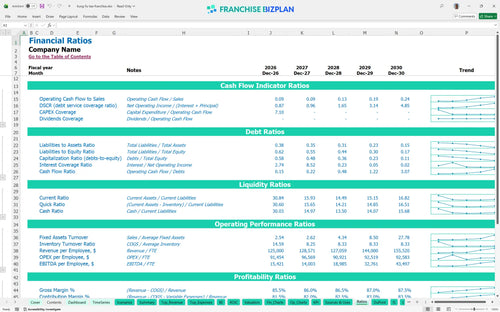
Performance metrics benchmark
We built this franchise unit financial model using our own research into the bubble tea market to help you make a data-driven decision. The assumptions for the $37,000 franchise fee, 4% royalty, and $15,000 monthly rent are pre-populated but fully editable to match your specific territory. It shows you exactly how a unit scaling to $1.55 million in revenue handles its $479,000 build-out cost. Data beats a gut feeling every time.
The unit shows immediate operational profitability with a year-one EBITDA of $93,000, which grows to $435,000 by year five. While monthly cash flow turns positive quickly, the high initial investment means you are focused on long-term equity building. Profitability is a marathon, not a sprint.
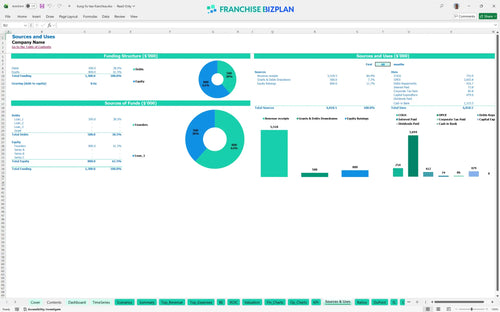
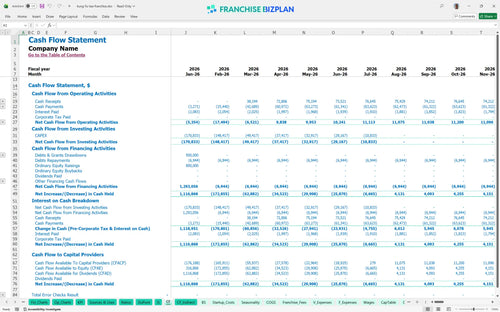
You need approximately $479,000 to cover the initial build-out, including $200,000 for leasehold improvements and $110,000 for beverage equipment. The model tracks a minimum cash need of $784,000 in July 2026 to account for the franchise fee and early operating ramp. Cash is the fuel that gets you to the grand opening.
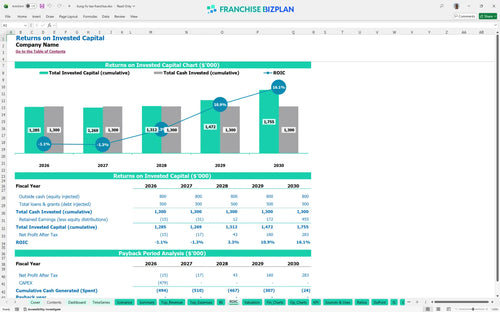
The internal rate of return (IRR) is 1.77%, with a return on equity (ROE) of 0.57. Because of the significant $479,000 startup cost and high rent, full payback of your initial capital occurs after the fifth year of operation. Patience is a requirement for this specific investment.
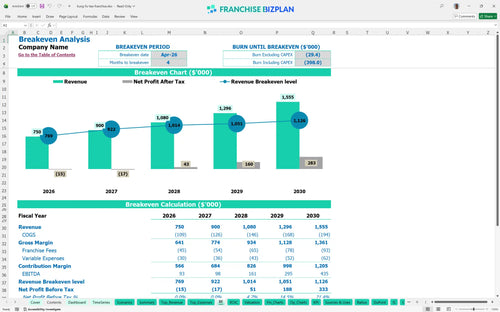
The unit reaches its monthly break-even point in April 2026, just four months after the doors open. To cover the $15,000 rent and $2,000 utilities, you must maintain high daily traffic and a strong average ticket. Speed to break-even is the best stress reliever.
The lowest cash point occurs in July 2026 at $784,000, which includes your startup capital and initial working capital buffer. You need to manage the timing of your $65,000 furniture and $18,000 signage payments to avoid a crunch. A cash buffer is your best insurance policy.
If revenue hits the high-case scenario through better local marketing, your year-one $93,000 EBITDA could climb significantly. Still, a 10% drop in sales would delay your April 2026 break-even and increase your peak cash need. Anyway, planning for the worst helps you reach the best.
Finance: update unit break-even and payback model by Friday
This franchise financial model is built in Excel so you can change every assumption to fit your specific market. You can defintely adjust the $15,000 monthly rent or the $65,000 manager salary to see how it impacts your bottom line. It uses pre-filled formulas that update instantly when you change your local labor rates or beverage prices. Your model should be as flexible as your menu.

Success in the beverage industry requires looking past the grand opening to see long-term viability. This tool provides a detailed five-year outlook, showing revenue growing from $750,000 in year one to over $1.5 million by year five. It maps out your cash flow and balance sheet so you can plan for future equipment upgrades or additional locations. Five years is the difference between a job and an asset.

Franchise obligations like the 4% royalty and 2% marketing fund are critical to track because they come off the top. This model automatically calculates these fees against your projected sales of bubble tea and fruit tea. It helps you see the real margin left over after the brand takes its share of the $750,000 annual volume. Don't let royalties surprise your bank account.

Launching a unit requires a clear view of your total $479,000 initial investment, including $200,000 for leasehold improvements. This model identifies the exact sales volume you need to cover fixed costs like your $15,000 prime location rent. It breaks down the math so you know if your $50,000 in topping sales is enough to keep the lights on. Knowing your number changes how you sleep at night.

We include industry-standard benchmarks so you can compare your 12% ingredient costs against typical beverage shop performance. This helps you sanity-check your $29,000 crew member salaries to ensure your labor model is sustainable. If your occupancy costs are too high relative to your $750,000 revenue, the model will highlight the gap. Benchmarks are the guardrails for your ambition.


Simply purchase and download the financial model template, then access it instantly using Microsoft Excel or Google Sheets. No installation or technical expertise required-just open and start working.

Enter your business-specific numbers, including revenue projections, costs, and investment details. The pre-built formulas will automatically calculate financial insights, saving you time and effort.

Leverage the investor-ready format to confidently showcase your financial projections to banks, franchise representatives, or investors. Impress stakeholders with clear, data-driven insights and professional reports.

Leverage the investor-ready format to confidently present your projections to banks, franchise representatives, or investors.