
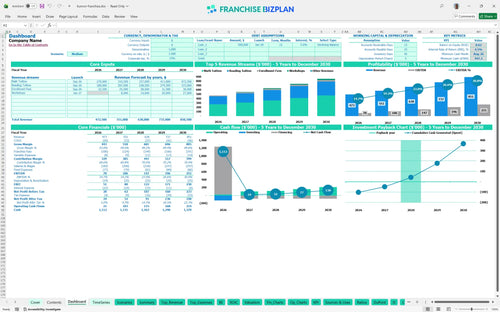
All-in-one Dashboard
Core inputs and core outputs


This Excel template for franchise unit financial planning includes detailed revenue drivers, automated tax calculations, and a professional dashboard for investor presentations.
Core inputs and core outputs
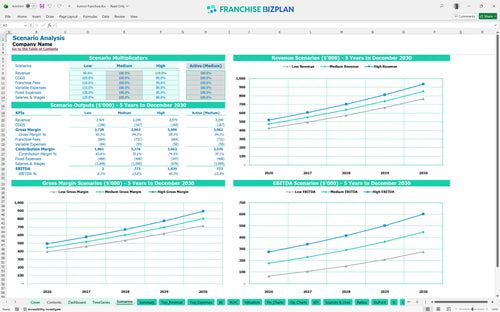
Three scenario analysis
Presentation ready
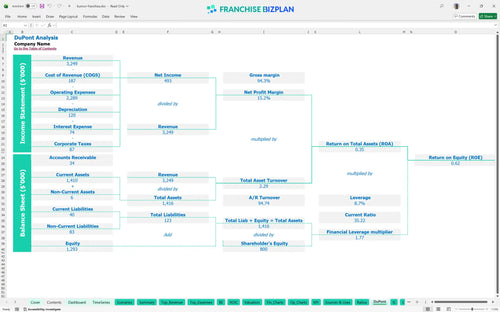
DuPont analysis
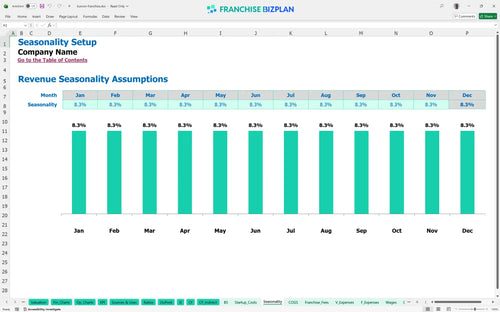
Researched revenue assumptions
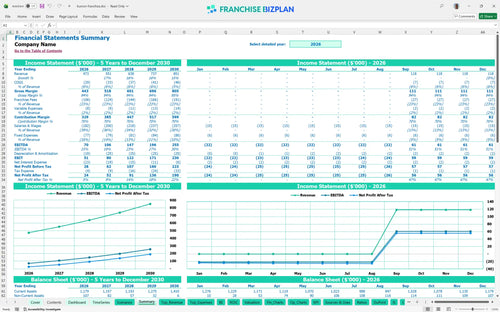
Lender-friendly financial outputs
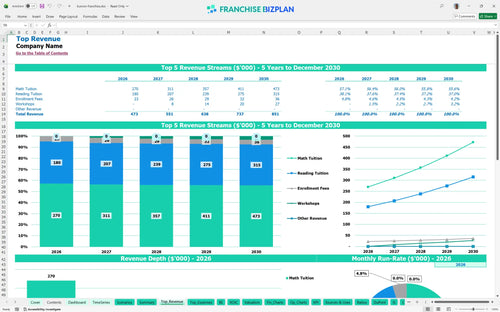
Revenue stream detailed view
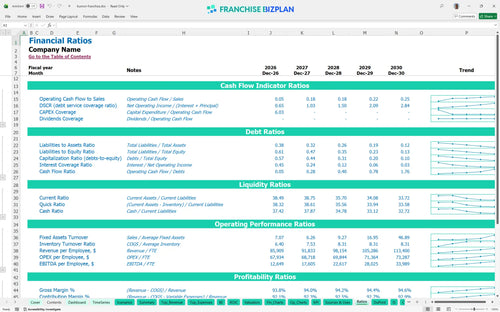
Performance metrics benchmark
We built this education franchise business plan model using deep research into the supplemental learning sector. Key assumptions like the 22.5% royalty, $473,000 year-one revenue, and the 9-month ramp-up to break-even are pre-populated but fully editable to fit your specific territory. This tool provides the data-driven clarity you need to move from a prospect to a confident operator.
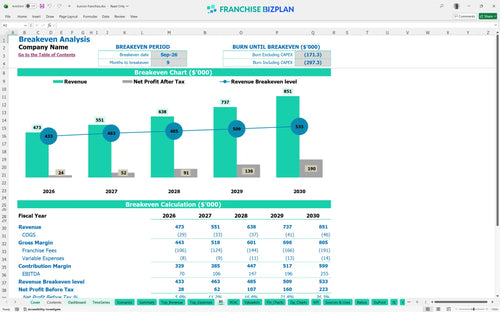
The franchise unit profitability analysis shows the center reaching positive EBITDA of $70,000 in its first year. By year five, as student volume matures and tuition revenue hits $851,000, annual EBITDA climbs to $255,000 after all royalties and materials. Profitability is a function of enrollment density and keeping instructor hours tightly mapped to student sessions.
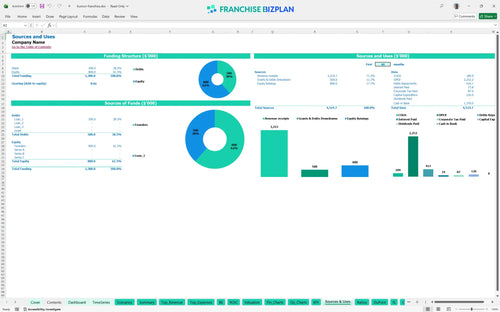
To launch this tutoring center financial projection, you need approximately $126,000 in initial capital for the build-out and equipment. This covers the $50,000 in leasehold improvements and $20,000 for furniture, plus a $2,000 franchise fee. The model also accounts for a significant cash reserve to handle the ramp-up phase before the center reaches its break-even point in month nine.
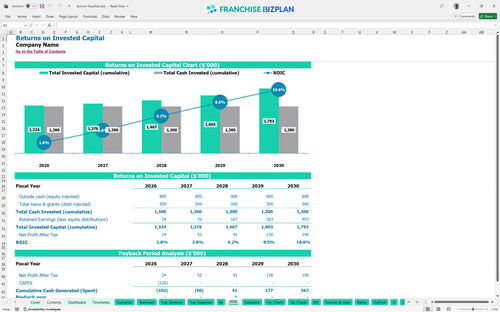
The franchise investment ROI is characterized by a 3-year payback period and an internal rate of return (IRR) of 4.47%. While the initial returns are steady, the real value lies in the recurring revenue for tutoring franchises, which drives a 0.62 return on equity. This model helps you see how long-term student retention compounds your initial investment over the five-year hold.
The center hits its break-even date in September 2026, roughly 9 months after the initial investment begins. The primary driver for reaching this point is the enrollment volume for Math and Reading tuition, which must cover the $4,200 monthly rent and the high 22.5% royalty burden. Break-even is less about the $15,000 in enrollment fees and more about consistent monthly recurring tuition.
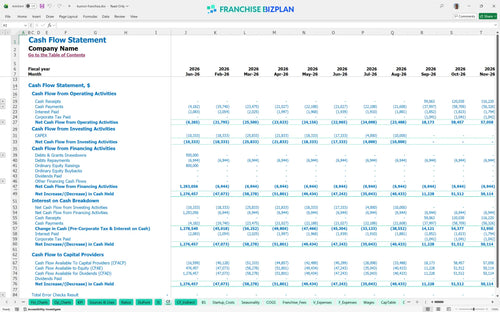
The model identifies the lowest cash point in August 2026, just before the center breaks even. With a minimum cash position of $947,000 indicated in the data, you have a massive buffer, but in a real-world scenario, you should monitor the timing of the $50,000 leasehold payments. Managing the gap between paying instructors and receiving monthly tuition is the key to protecting your operating budget.
Estimating profitability for new franchise locations requires looking at how a 10% drop in enrollment affects your ability to pay the 22.5% royalty. In a high-growth scenario, revenue jumps from $473,000 to $851,000, which defintely accelerates your ROI and boosts the year-5 EBITDA to $255,000. Low scenarios usually fail not on rent, but on the inability to scale instructor costs down when student volume dips.
This franchise financial model template is built in Excel with a logic-driven structure that lets you swap assumptions in seconds. You can adjust student enrollment numbers, tuition rates, and staff hours to see how local market shifts impact your bottom line. It is a flexible tool designed for the specific unit economics of a supplemental education center. One wrong assumption on enrollment ramp-up can sink a budget, so we made every cell editable.

Planning a tutoring center requires looking past the first year to understand how recurring student cycles drive long-term value. This model provides a full 5-year outlook, showing revenue growing from $473,000 in year one to $851,000 by year five. You get a clear view of the P&L, balance sheet, and cash flow to ensure the business stays healthy as you scale. Small business financial forecasting is about spotting the cliff before you drive over it.

The franchise royalty fee structure for this concept is significant at 22.5%, which directly impacts your store-level margin. This model automatically calculates these ongoing costs alongside the initial $2,000 franchise fee to show you the true cost of the brand. Understanding how much of every tuition dollar stays in your pocket versus going to the franchisor is vital for survival. High royalties mean you must obsess over throughput and instructor efficiency.

Using our franchise startup cost calculator, you can map out the $126,000 needed for leaseholds, furniture, and equipment. The model identifies exactly when you stop burning cash, which in this case is projected for September 2026. Knowing your break-even sales level helps you set realistic enrollment targets for your center manager. If you don't know your nut, you can't crack it.

We have integrated educational center operating expenses like the $4,200 monthly rent and instructor wages to give you a realistic starting point. These benchmarks help you verify if your $20,000 instructor salaries and 5% workbook costs align with typical industry standards. Comparing your projected performance against these figures ensures your business plan isn't based on wishful thinking. Real-world data beats a best-case scenario every time.


Simply purchase and download the financial model template, then access it instantly using Microsoft Excel or Google Sheets. No installation or technical expertise required-just open and start working.

Enter your business-specific numbers, including revenue projections, costs, and investment details. The pre-built formulas will automatically calculate financial insights, saving you time and effort.

Leverage the investor-ready format to confidently showcase your financial projections to banks, franchise representatives, or investors. Impress stakeholders with clear, data-driven insights and professional reports.

Leverage the investor-ready format to confidently present your projections to banks, franchise representatives, or investors.