
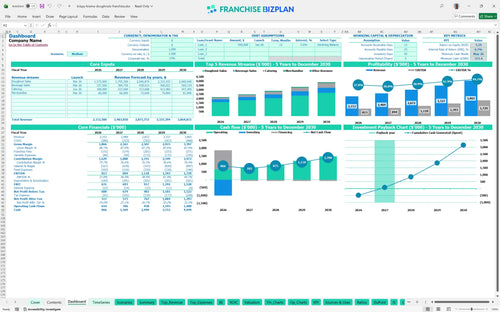
All-in-one Dashboard
Core inputs and core outputs


This franchise unit financial model template provides a complete Excel-based toolkit for projecting doughnut shop performance, from initial build-out to 5-year exit values.
Core inputs and core outputs
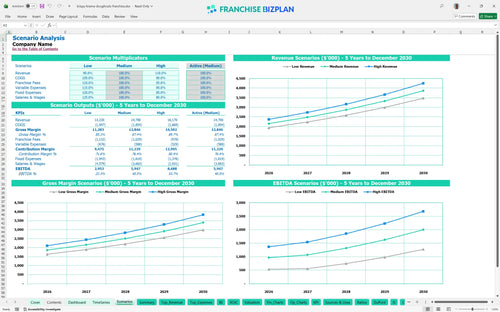
Three scenario analysis
Presentation ready
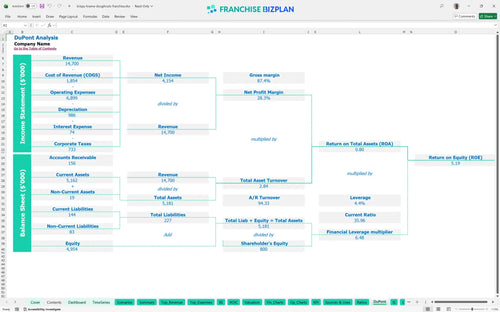
DuPont analysis
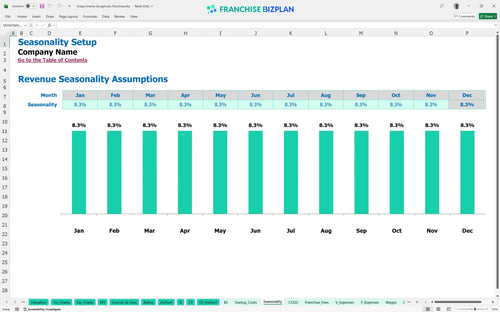
Researched revenue assumptions
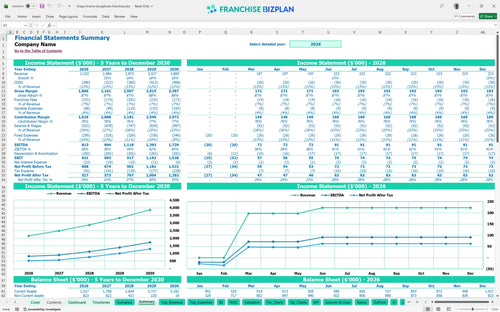
Lender-friendly financial outputs
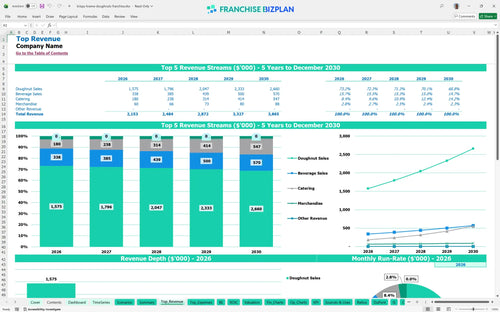
Revenue stream detailed view
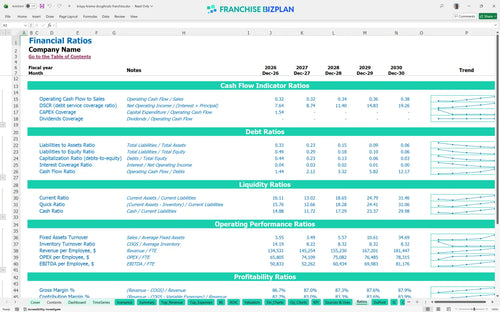
Performance metrics benchmark
We built this financial planning guide for new franchise owners using deep research into high-volume doughnut production and 24-hour retail operations. All assumptions, including the $2,153,000 Year 1 revenue target and the $1,005,000 total capital expenditure, are pre-populated and fully editable to fit your Nashville or US-based territory. This doughnut shop business plan is designed to be a pragmatic tool for serious operators who value data over hype.
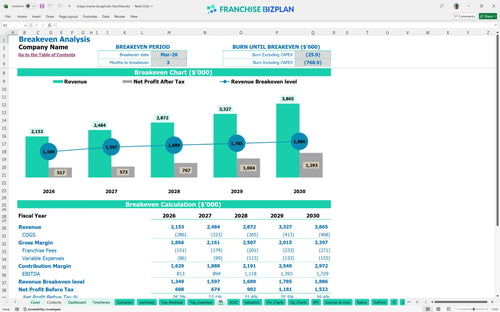
Your unit reaches profitability almost immediately, with a projected breakeven date in March 2026, just three months after launch. With Year 1 EBITDA starting at $813,000 and climbing to $1,729,000 by Year 5, the model shows a strong upward curve driven by a B2B catering revenue projection model for restaurants. Profit isn't an accident; it's a schedule you have to manage daily.
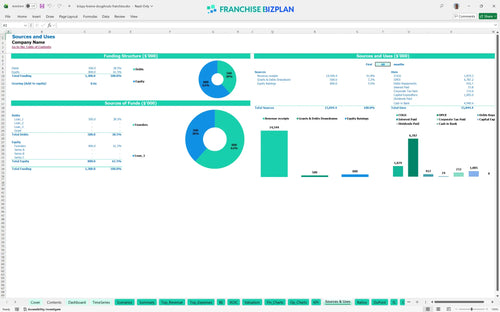
You need a total capital expenditure forecast of $1,005,000 to get the doors open and the machinery running. This includes the $25,000 franchise fee, a massive $450,000 for leasehold improvements to create the 'Theater' experience, and $300,000 for proprietary production equipment. Cash out the door is your biggest risk during the 90-day build-out phase.
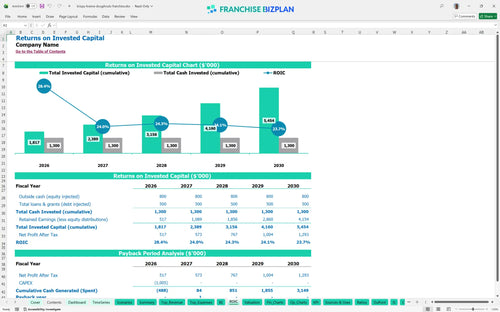
Based on the $1,005,000 investment, your franchise unit ROI calculation shows a 2-year payback period, which is exceptionally fast for the QSR (Quick Service Restaurant) sector. The Internal Rate of Return (IRR) stands at 6.75% with a Return on Equity (ROE) of 5.19% in the initial years. Time is the enemy of ROI, so hitting your March 2026 launch date is critical.
The unit hits its monthly break-even point in month 3, requiring enough volume to cover $15,000 in monthly rent and $3,200 in utilities. This break-even analysis tool shows that labor for bakers and crew is your biggest variable lever. Using a doughnut shop 24-hour operations expense calculator helps you balance the 'Hot Now' promise with labor costs. Volume solves almost every problem in a high-fixed-cost model.
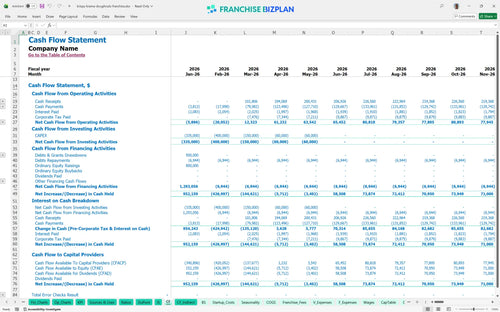
Your lowest cash point occurs in May 2026, with a minimum cash balance of $371,000 after the initial ramp-up. This Excel template for franchise unit cash flow projections suggests you have a comfortable buffer, but you must monitor the $2,000 monthly digital marketing spend closely. The lowest point is where most owners quit, so keep your eyes on the May-26 dip.
The difference between the $2.1M Year 1 revenue and the $3.8M Year 5 target depends on your profit margin analysis for quick-service restaurant units. In a high-growth scenario, your EBITDA margin expands as fixed costs like the $15,000 rent are diluted by higher ticket counts. Planning for the worst makes the best possible, so run your 'Low' case with 20% less foot traffic. Still, the 2-year payback remains robust across most medium-growth paths.
This franchise financial model template is built in Excel to give you total control over your doughnut shop's future. You can swap out pre-filled formulas and editable assumptions to match your specific territory, whether you're looking at a high-traffic urban corner or a suburban strip. It's defintely the most flexible operating expense spreadsheet you'll find for this niche. It's built to be broken and rebuilt as your site selection changes.

Success in the food industry requires looking past the grand opening, so this model provides detailed food franchise financial projections through year five. You'll see exactly how revenue scales from $2,153,000 in Year 1 to over $3,865,000 by Year 5 as your local brand equity grows. This franchise financial forecasting spreadsheet for entrepreneurs maps every dollar of cash flow. Five years is a lifetime in retail, so plan accordingly.

This retail franchise profitability model handles the heavy lifting of calculating your 4.5% royalty and 2.5% marketing fund contributions automatically. We've baked in the $25,000 initial franchise fee so you can see the immediate impact on your day-one liquidity and ongoing store-level margin. Understanding these obligations is the only way to see your true take-home pay. Royalties are the tax on your top line that never goes away.

Knowing how to calculate startup costs for a doughnut franchise is the difference between a successful launch and a mid-build-out crisis. Our franchise startup cost analysis covers the $450,000 in leasehold improvements and $300,000 in production equipment needed to get the 'Hot Now' light turning. You'll see exactly what sales volume is required to cover your $15,000 monthly rent. Speed to breakeven is the only metric that keeps you sleeping at night.

We've included a unit economics assessment based on real-world doughnut shop performance, including food ingredient costs that start at 11.5%. The model helps with estimating labor costs for high-volume food franchises, ensuring your 24-hour staffing levels don't eat your entire bottom line. Compare your projected $813,000 Year 1 EBITDA against industry norms to ensure your plan is realistic. Don't ignore the benchmarks if you want to stay in business.


Simply purchase and download the financial model template, then access it instantly using Microsoft Excel or Google Sheets. No installation or technical expertise required-just open and start working.

Enter your business-specific numbers, including revenue projections, costs, and investment details. The pre-built formulas will automatically calculate financial insights, saving you time and effort.

Leverage the investor-ready format to confidently showcase your financial projections to banks, franchise representatives, or investors. Impress stakeholders with clear, data-driven insights and professional reports.

Leverage the investor-ready format to confidently present your projections to banks, franchise representatives, or investors.