
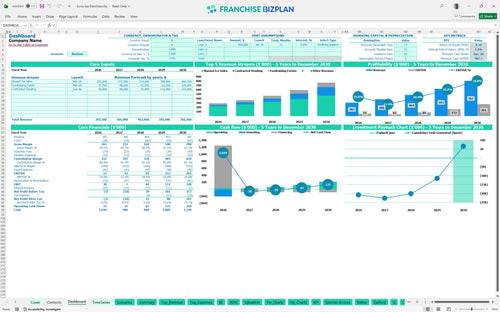
All-in-one Dashboard
Core inputs and core outputs


This Excel template for mobile franchise business provides a complete roadmap from initial $205,000 investment to mature-unit cash flow.
Core inputs and core outputs
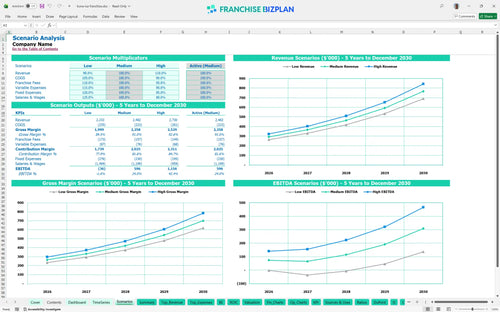
Three scenario analysis
Presentation ready
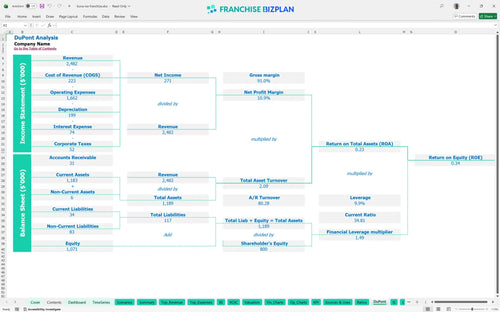
DuPont analysis
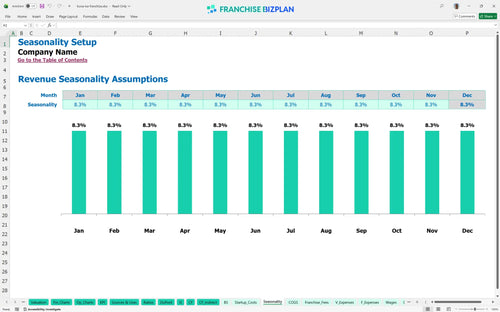
Researched revenue assumptions
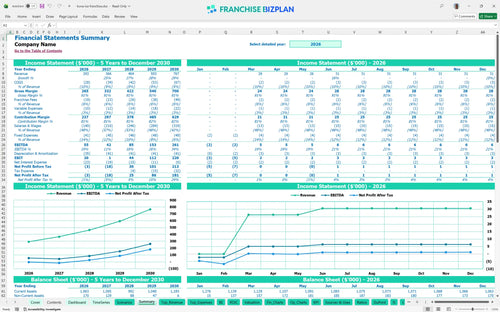
Lender-friendly financial outputs
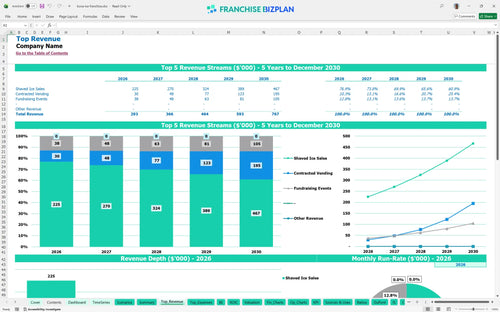
Revenue stream detailed view
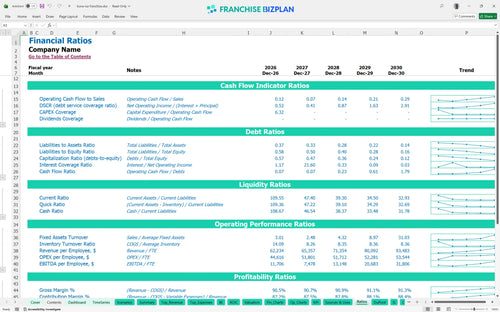
Performance metrics benchmark
We built this franchise unit financial model using our own research to provide a comprehensive franchise unit financial feasibility study. Key assumptions, including the mobile food franchise revenue model and $205,000 in startup costs, are pre-populated with researched data and are fully editable. This tool helps you move from a basic franchise business plan template to a precise, data-driven operating plan.
You can expect to hit positive EBITDA quickly, with year one showing $55,000 in earnings despite the ramp-up phase. By year five, the model projects EBITDA climbing to $261,000 as you optimize route density and event contracts, even after accounting for the 6% royalty and 1.5% packaging costs.
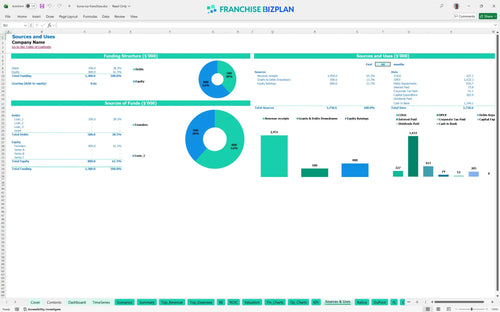
Launching this unit requires a total initial investment of $205,000 to get the vehicle on the road and fully equipped. This franchise investment analysis covers the $15,000 franchise fee and the $125,000 primary entertainment vehicle, plus essential gear like the $22,000 flavor station and $18,000 in shaving tools.
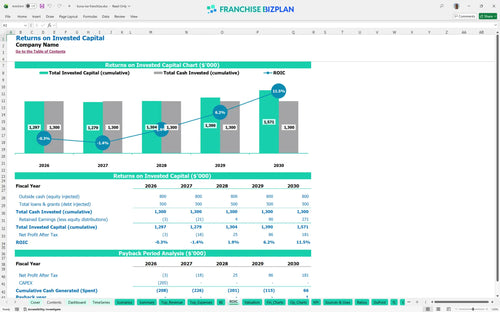
The franchise ROI calculation shows a 5-year payback period and an internal rate of return (IRR) of 2.19%. While the initial ROE is 0.34, the long-tail value lies in the steady revenue growth from $293,000 to $767,000, making this a stable cash-flow play for long-term operators.
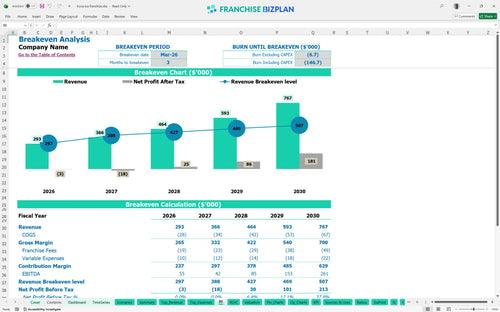
The model projects a fast break-even date of March 2026, just 3 months after the initial launch. Reaching this point depends heavily on hitting your retail sales targets and managing fixed costs like the $1,700 combined monthly insurance and storage fees.
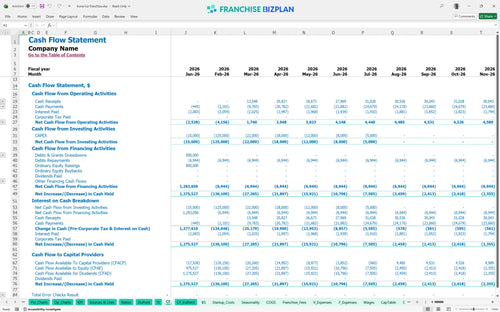
Your lowest cash point is defintely projected for December 2028, with a minimum cash balance of $968,000 including accumulated reserves. Using the best financial planning tools for franchise owners, you can see that while the runway is resilient, you still need a buffer for vehicle maintenance and seasonal dips.
Comparing Low vs Medium vs High scenarios shows how sensitive your franchise unit economics are to volume. A 10% drop in sales can delay your payback, while the high scenario demonstrates how to project revenue for a mobile shaved ice business when hitting peak tournament capacity and maximizing throughput.
Finance: update unit break-even and payback model by Friday
This franchise financial model template lives in Excel, giving you total control over the variables that drive your bottom line. You can swap out pre-filled research for your specific local reality, adjusting everything from seasonal traffic to hourly wages using this financial template for new franchise operators without breaking the math.

Mapping out a long-term trajectory is essential for any mobile franchise unit profitability analysis. This model tracks your climb from $293,000 in year one to $767,000 by year five, providing a detailed franchise cash flow forecast to help you visualize how scaling your fleet or event density impacts long-term sustainability.

Understanding the friction of a 6% royalty and a 0.33% marketing fund is vital for estimating profitability for mobile vending franchises. The model bakes these obligations directly into your monthly cash flow, so you see exactly how much stays in your pocket after the franchisor takes their cut from your gross sales.

This franchise startup cost calculator totals your initial $205,000 investment, covering the vehicle, equipment, and fees. By analyzing franchise royalty and operating costs alongside fixed expenses, the model helps you determine how to calculate franchise startup costs and identifies the exact sales volume needed to stop burning cash.

We include industry-standard business performance metrics to ensure your projections aren't just wishful thinking. Comparing your 8% ice and syrup costs or your $50,000 lead operator salary against typical mobile food truck operating expenses helps you spot margin leaks before they impact your store-level EBITDA.


Simply purchase and download the financial model template, then access it instantly using Microsoft Excel or Google Sheets. No installation or technical expertise required-just open and start working.

Enter your business-specific numbers, including revenue projections, costs, and investment details. The pre-built formulas will automatically calculate financial insights, saving you time and effort.

Leverage the investor-ready format to confidently showcase your financial projections to banks, franchise representatives, or investors. Impress stakeholders with clear, data-driven insights and professional reports.

Leverage the investor-ready format to confidently present your projections to banks, franchise representatives, or investors.