
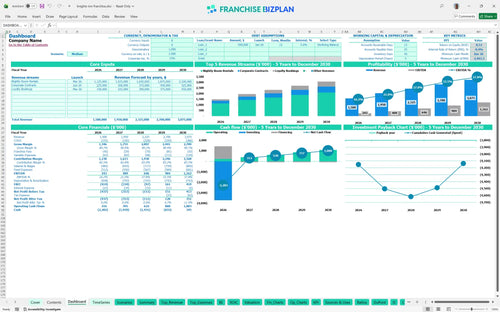
All-in-one Dashboard
Core inputs and core outputs


This comprehensive Excel tool provides a data-driven roadmap for estimating operating expenses for a budget hotel and projecting five years of unit-level financial performance.
Core inputs and core outputs
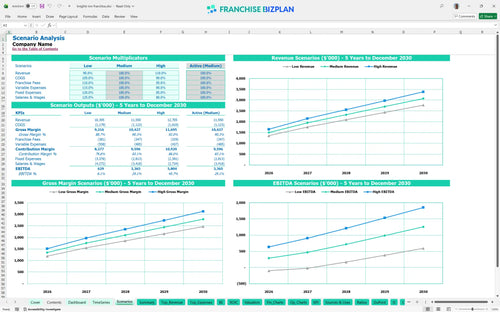
Three scenario analysis
Presentation ready
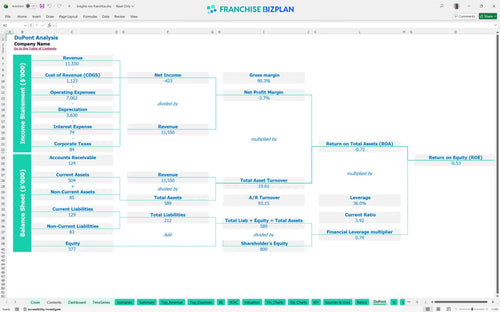
DuPont analysis
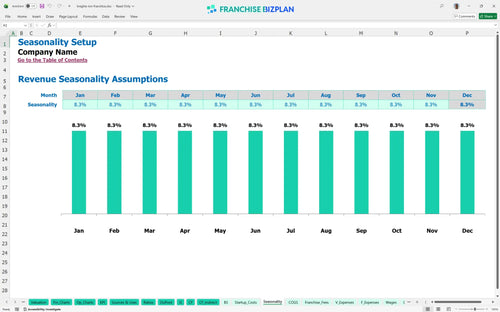
Researched revenue assumptions
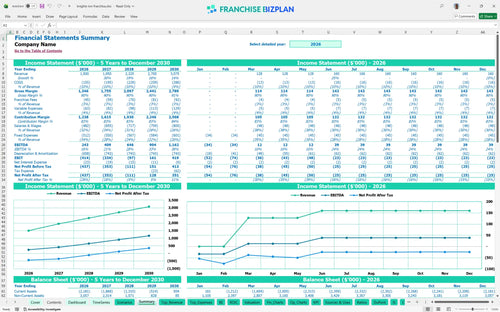
Lender-friendly financial outputs
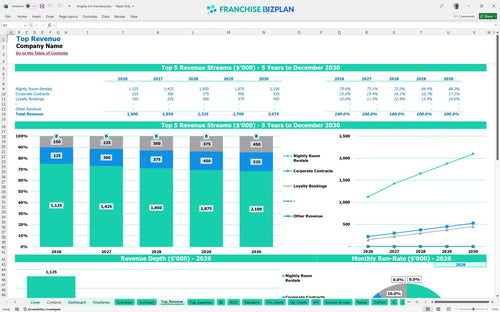
Revenue stream detailed view
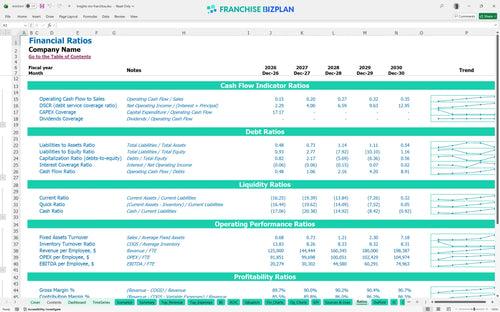
Performance metrics benchmark
We built this hotel franchise business plan financial projections model using detailed research on budget lodging operations and brand-specific requirements. The assumptions for nightly rentals, corporate contracts, and royalty fees are pre-populated with data like the $1.5 million year-one revenue target, but you can edit every cell to fit your market. This tool gives you a realistic look at the $243,000 year-one EBITDA and the capital stack needed to get open.
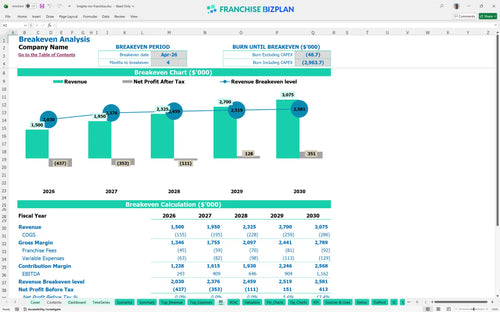
The model shows the unit hitting its break-even point in April 2026, just four months after the initial launch. While EBITDA is positive at $243,000 in the first year, true proftability depends on managing the 3% royalty fee and the $25,000 monthly lease. Here is the quick math: you need to scale from $1.5 million in year one to over $3 million by year five to maximize owner draws.
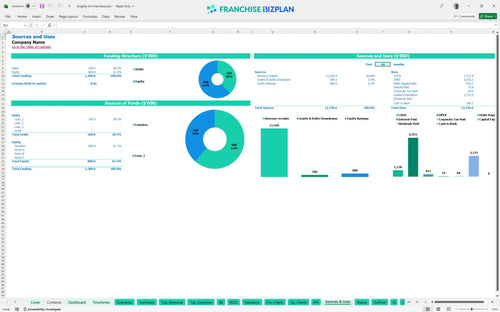
You will need approximately $3,715,000 to launch this unit, covering everything from the $15,000 franchise fee to $1.8 million in leasehold improvements. This hotel franchise startup budget Excel template tracks every dollar, including $400,000 for HVAC systems and $900,000 for furniture and fixtures. Plus, you must account for the $150,000 investment in IT and reservation systems required to stay competitive.
The franchise unit ROI analysis spreadsheet indicates an IRR of -0.42% and a payback period extending beyond the first five years. While year-five EBITDA reaches a healthy $1.16 million, the heavy initial CAPEX (capital expenditure) of over $3.7 million means you are playing a long-term game. To be fair, this estimate hides the potential real estate appreciation which often offsets slower cash-on-cash returns in hospitality.

To cover your $25,000 monthly rent and $32,000 in housekeeping salaries, you need to hit your break-even revenue by month four. The primary lever here is nightly room rentals, which are projected at $750,000 in the first year. If occupancy dips or the average ticket (daily rate) falls, the $7,500 monthly utility bill and other fixed costs will quickly pressure your margins.
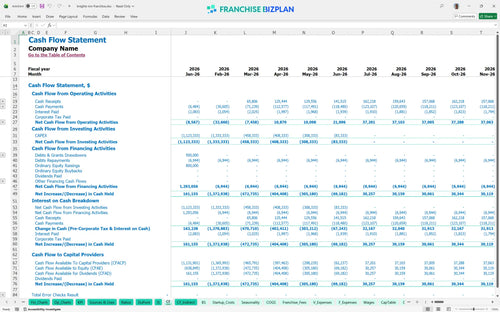
The lowest cash point occurs in June 2026 at -$2,463,000, which means you defintely need a significant capital reserve or financing facility in place. This financial model for roadside hotel investment highlights that the gap between construction and stable occupancy creates a massive cash drain. Still, once you clear the first six months, the ramp-up in corporate contracts helps stabilize the monthly burn.
Analyzing revenue streams for budget lodging franchises shows that a 10% drop in occupancy can delay your break-even by several months and deepen the peak cash need. In the high-case scenario, aggressive local marketing and high-traffic roadside signage push year-one revenue past the $1.5 million mark, significantly improving your ROI. The model lets you toggle these scenarios to see how sensitive your EBITDA is to labor price hikes.
This hotel franchise financial model is built in Excel with fully editable assumptions, allowing you to swap out local tax rates or specific labor costs without breaking the logic. You can adjust every driver from nightly rates to seasonal occupancy, making it easy to see how a shift in local demand changes your bottom line. It is a flexible franchise startup cost template that adapts to your specific site and territory needs.

Planning for a budget lodging investment requires a long-term view of how cash flows evolve as you move past the initial ramp-up phase. This tool provides a detailed 5-year outlook on revenue, EBITDA, and net income, ensuring you can see the impact of annual rent escalations and labor market shifts. It serves as a commercial real estate pro forma to help you secure financing and align with partner expectations.

The model simplifies how to calculate startup costs for a hotel franchise by isolating specific brand obligations like the $15,000 initial fee and the 3% royalty. By automating these calculations, you can see exactly how much cash stays in the unit versus what goes to the brand. This clarity is vital for financial planning for hospitality franchise owners who need to manage store-level margins against top-line growth.

Launching a new unit involves heavy upfront capital, from $1.8 million in leasehold improvements to $900,000 in furniture and equipment. This Excel template for hotel franchise financial forecasting helps you map these costs against your opening timeline to identify the exact sales volume needed to cover your monthly fixed expenses. Understanding your margin and contribution early prevents surprises during the critical first year of operation.

We have integrated hospitality industry forecasting standards to help you sanity-check your projections for housekeeping supplies and utility costs. If your proftability (proftability) assumptions drift too far from budget lodging norms, the model helps you identify the gap before you sign a lease. It is an essential budget hotel franchise profitability calculator for comparing your unit against typical chain performance.


Simply purchase and download the financial model template, then access it instantly using Microsoft Excel or Google Sheets. No installation or technical expertise required-just open and start working.

Enter your business-specific numbers, including revenue projections, costs, and investment details. The pre-built formulas will automatically calculate financial insights, saving you time and effort.

Leverage the investor-ready format to confidently showcase your financial projections to banks, franchise representatives, or investors. Impress stakeholders with clear, data-driven insights and professional reports.

Leverage the investor-ready format to confidently present your projections to banks, franchise representatives, or investors.