
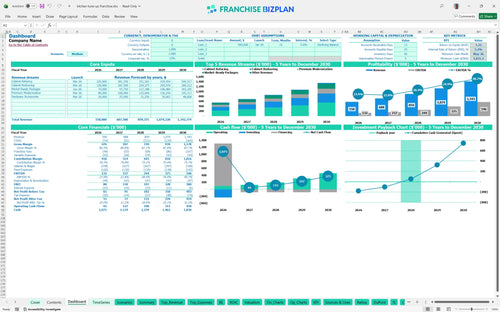
All-in-one Dashboard
Core inputs and core outputs


This franchise financial projection spreadsheet provides a complete roadmap for managing a kitchen remodeling territory, from initial investment to five-year exit values.
Core inputs and core outputs
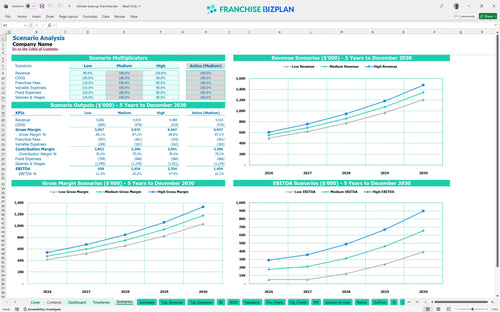
Three scenario analysis
Presentation ready
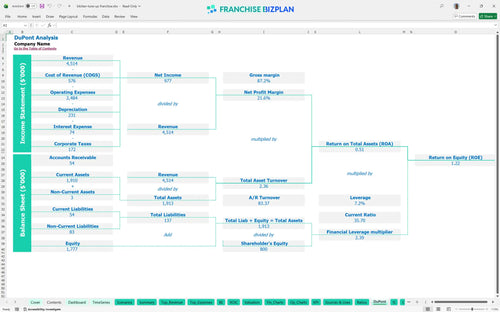
DuPont analysis
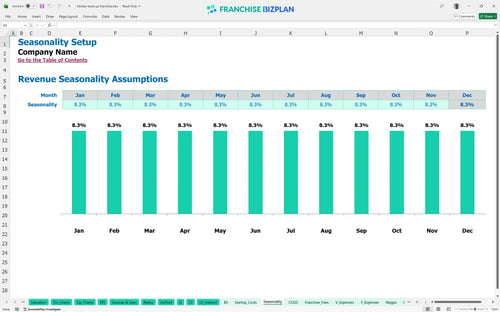
Researched revenue assumptions
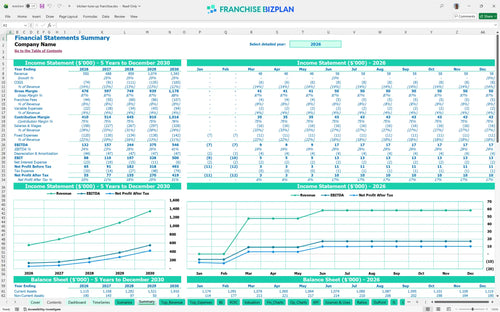
Lender-friendly financial outputs
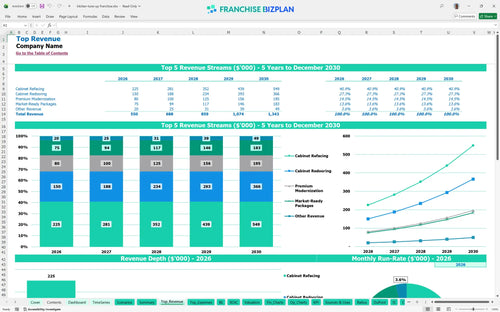
Revenue stream detailed view
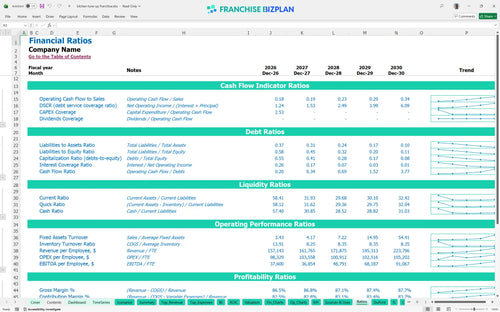
Performance metrics benchmark
We built this financial model for cabinet refacing franchise unit operators using deep research into the home improvement sector. The assumptions for revenue streams, like the $150,000 projected for refacing in year one, and operating costs like the $1,200 monthly mobile showroom lease, are pre-populated but fully editable. You can trust these numbers to show a realistic Year 1 EBITDA of $132,000 while you plan your rollout. We defintely focused on accuracy over hype to help you make a real decision.
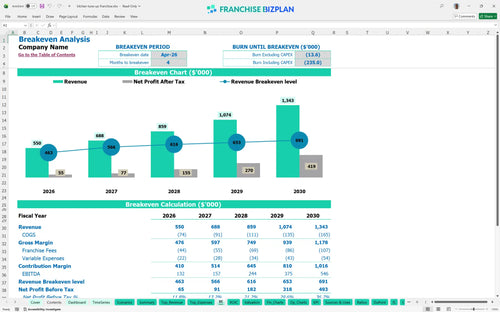
Your unit is projected to hit break-even by April 2026, just four months after launching. Profitability climbs steadily as you scale, with EBITDA growing from $132,000 in the first year to $546,000 by year five. This franchise unit profitability analysis assumes you manage your material costs effectively as project volume increases across your service area.
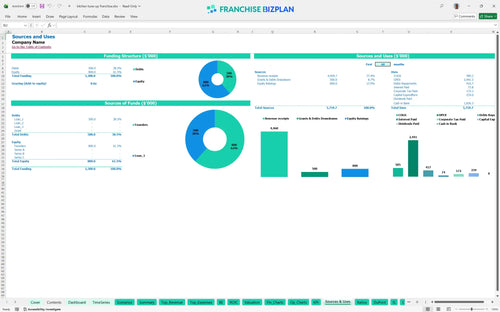
Launching this home improvement franchise investment requires a total initial outlay of approximately $233,950. This covers everything from the brand fee to your mobile showroom vehicles and the initial materials inventory needed to start projects. Budgeting for a new home improvement franchise location means accounting for both the big equipment buys and the smaller digital visualization tools used for sales.
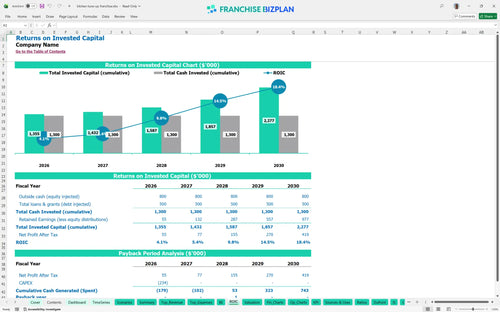
The franchise investment return on investment analysis shows a 5.23% internal rate of return and a 1.22 return on equity. You can expect to see your full initial investment paid back within 3 years. These metrics are based on hitting your revenue targets for cabinet redooring and premium modernization packages across your territory while maintaining strict cost controls.
You need to reach your break-even point by month 4 to stay on track with the model. The primary driver for reaching this goal is the volume of cabinet refacing jobs, which are your largest revenue source. Managing the 11% material cost and keeping your $6,000 monthly rent in check is vital for early survival. Still, the speed of your installation crew is what really moves the needle.
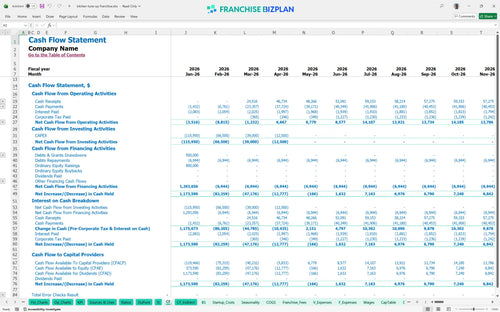
The lowest cash point occurs in May 2026, with a minimum cash balance of $1,031,000 projected in the model. This financial projections for mobile showroom business tool suggests you maintain a healthy buffer to handle the ramp-up phase. If your project starts are delayed by even 30 days, your working capital needs will spike quickly, so keep an eye on your sales funnel.
Using the franchise business plan financial assumptions template, you can see how a 20% swing in revenue impacts your bottom line. In the high case, your Year 1 EBITDA could significantly exceed $132,000 if your designer-led consultations close at a higher rate. Conversely, the low case might extend your 3-year payback period if local demand for kitchen updates softens during a downturn.
This franchise financial model template is built in Excel, allowing you to tweak every variable from local Scottsdale rent to specific labor rates. You can use the pre-filled formulas to test different pricing for cabinet refacing or adjust your staffing plan as you scale from one to multiple mobile showrooms. It is a flexible Excel template for franchise unit financial planning that adapts to your specific territory needs.

Mapping out your long-term success is easier with a business plan template for franchise owners that covers a full 60-month outlook. This tool provides detailed small business financial forecasting, showing how your revenue can grow from $550,000 in Year 1 to over $1.3 million by Year 5. You get a clear view of your projected balance sheet and cash flow to ensure your kitchen remodeling franchise opportunities remain viable over the long haul.

Understanding the franchise royalty fee structure is critical for maintaining store-level margins. This model automatically calculates the 6% royalty and 2% marketing fund contributions based on your monthly sales projections. By tracking these ongoing costs alongside the initial $79,950 franchise fee, you can see exactly how much cash stays in your pocket after meeting brand standards and paying the franchisor.

Use this franchise startup cost calculator to estimate the total capital needed before you open your doors. It helps you figure out how to calculate startup costs for a home service franchise, including leasehold improvements and initial inventory. The model identifies your break-even sales level, so you know exactly how many kitchen updates you need to perform each month to cover your $6,000 hub rent and other fixed costs.

Analyzing profitability for residential remodeling franchises requires comparing your estimates against real-world data. This model includes benchmarks for cabinet materials and subcontractor fees, which we have set at 3.2% of revenue. These markers help you sanity-check your kitchen renovation franchise profit margins and ensure your labor costs for designers and installers stay within a healthy range for the home improvement industry.


Simply purchase and download the financial model template, then access it instantly using Microsoft Excel or Google Sheets. No installation or technical expertise required-just open and start working.

Enter your business-specific numbers, including revenue projections, costs, and investment details. The pre-built formulas will automatically calculate financial insights, saving you time and effort.

Leverage the investor-ready format to confidently showcase your financial projections to banks, franchise representatives, or investors. Impress stakeholders with clear, data-driven insights and professional reports.

Leverage the investor-ready format to confidently present your projections to banks, franchise representatives, or investors.