
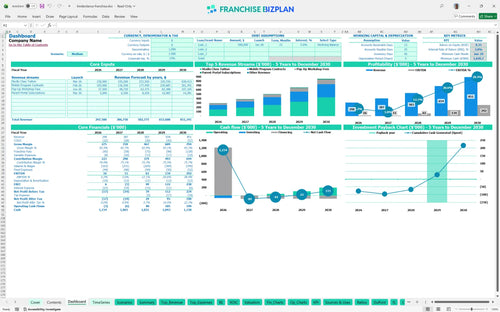
All-in-one Dashboard
Core inputs and core outputs


This franchise financial model template provides a comprehensive Excel template for franchise unit financial forecasting, covering everything from initial CAPEX to 5-year EBITDA growth.
Core inputs and core outputs
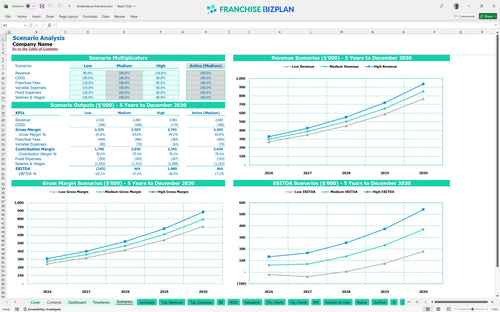
Three scenario analysis
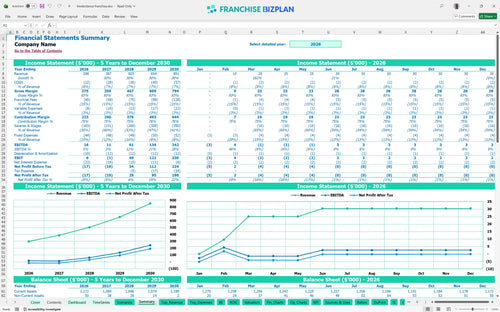
Presentation ready
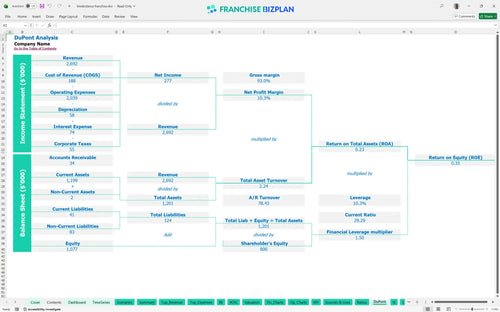
DuPont analysis
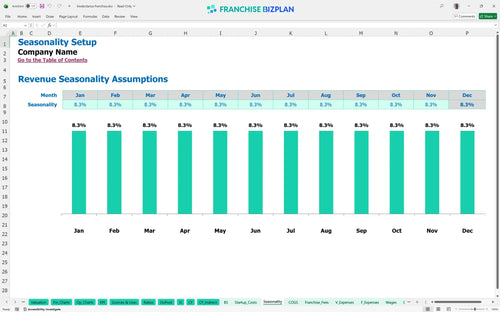
Researched revenue assumptions
Lender-friendly financial outputs
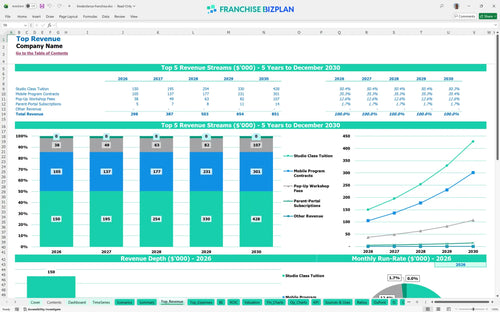
Revenue stream detailed view
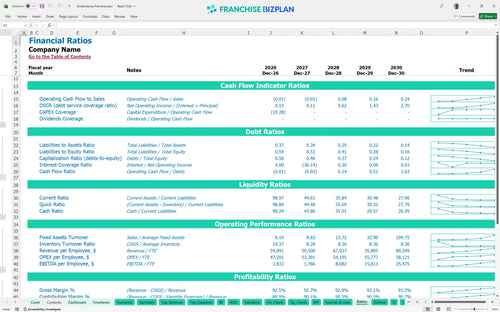
Performance metrics benchmark
We built this franchise unit financial model based on deep research into the mobile and studio-based education sector. Key assumptions-including the dual-revenue streams of studio tuition and mobile contracts, a 12% royalty, and a $20,000 initial fee-are pre-populated and fully editable. With year-one revenue starting at $298,000 and scaling to $851,000, this tool helps you map the path to a $242,000 annual EBITDA.
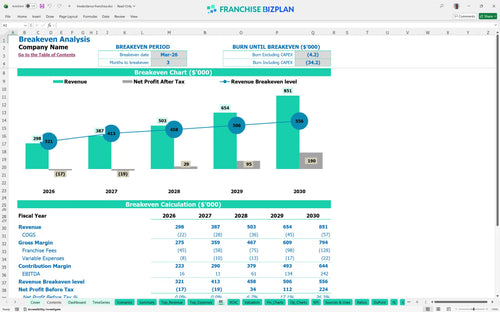
This franchise unit becomes profitable very quickly, hitting its break-even point in March 2026, just three months after launch. While year one generates a modest $16,000 EBITDA, the model shows profitability scaling to $242,000 by year five as you maximize instructor productivity and mobile contract density. Speed to profit is the name of the game here.
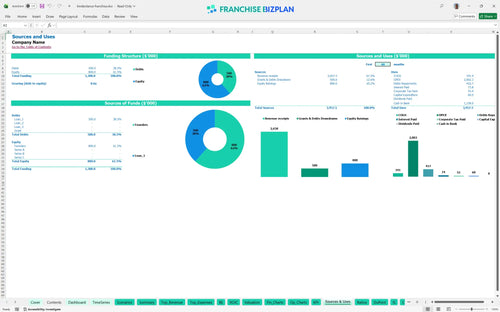
To launch this unit in the US, you need to account for a $20,000 franchise fee and approximately $48,000 in initial CAPEX for items like flooring, sound systems, and leasehold improvements. The model aggregates these startup costs with your initial working capital to show the total cash needed before you open your doors. Estimating break-even point for a new franchise location starts with knowing your total entry cost.
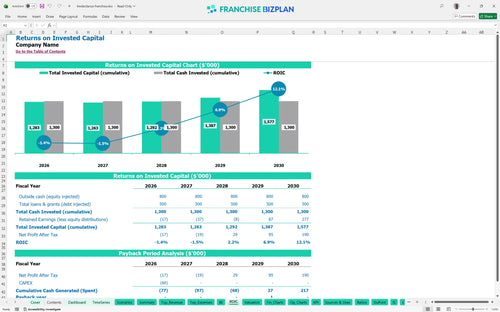
Investors can expect a 4-year payback period on their initial capital outlay. The model calculates an Internal Rate of Return (IRR) of 3.84% and a Return on Equity (ROE) of 0.35, reflecting the steady growth of a mobile franchise revenue streams model. While the IRR is conservative, the cash flow stability of the education sector provides a solid foundation for multi-unit growth.
The monthly break-even occurs in month 3, driven by the low overhead of the mobile program contracts. To cover your $2,200 monthly rent and $50,000 manager salary, you need to maintain a steady flow of studio tuition and workshop fees. The biggest pressure on your break-even is the 15% combined royalty and marketing burden. Still, the dual-revenue approach makes the hurdle manageable.
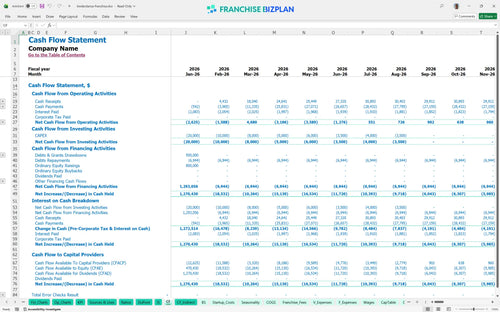
The model shows the lowest cash point occurring in January 2029, which indicates that even as revenue grows, your cash reserves need careful monitoring. You should plan for at least 6 months of runway to handle the timing gaps between hiring instructors and collecting tuition. We defintely recommend keeping a cash buffer for those months when enrollment might dip. Cash is king, even in a growing business.
In a high-growth scenario, reaching $851,000 in revenue by year five results in a significant EBITDA margin of 28%. However, if you hit the low case, the fixed costs of the studio and the $32,000 administrative salary will squeeze your cash flow. Evaluating franchise investment returns for small business owners requires looking at these downside risks before committing. Execution at the local level is what separates the high case from the low case.
This franchise unit financial model is fully customizable in Excel, giving you a professional-grade tool to stress-test your assumptions. It comes with pre-filled formulas and editable inputs for revenue, staffing, and local overhead, so you can adapt the numbers to your specific territory and lease terms. Every 1-point margin leak matters fast in a single-unit model.

Long-term planning requires more than just a gut feeling about next month's sales. This model provides detailed 5-year revenue, cost, and cash flow projections tailored for a small franchise chain or a single unit. It tracks your evolution from a $298,000 year-one operation to a mature $851,000 business by year five. Planning for the long haul is the only way to survive the ramp-up phase.

We built this to capture the real-world franchise royalty fee structure, including the $20,000 initial fee and the ongoing 12% royalty. The model also factors in the 3% brand marketing fund contribution so you can see the impact on your store-level margin. Understanding exactly how much goes to the franchisor before you pay your own bills is vital for any operator.

Use the franchise startup cost calculator to map out your total initial investment, from leasehold improvements to specialized dance flooring. The model includes a clear break-even analysis, helping you identify the exact sales volume needed to cover your $2,200 monthly rent and $3,800 in other fixed costs. Knowing your floor helps you sleep better at night.

The model incorporates built-in benchmarks for an early childhood education business model to help you sanity-check your projections. We have included typical ranges for labor and gross margins so you can compare your performance against the broader children's enrichment franchise business plan standards. If your labor costs are way off the benchmark, you need to know why before you open.


Simply purchase and download the financial model template, then access it instantly using Microsoft Excel or Google Sheets. No installation or technical expertise required-just open and start working.

Enter your business-specific numbers, including revenue projections, costs, and investment details. The pre-built formulas will automatically calculate financial insights, saving you time and effort.

Leverage the investor-ready format to confidently showcase your financial projections to banks, franchise representatives, or investors. Impress stakeholders with clear, data-driven insights and professional reports.

Leverage the investor-ready format to confidently present your projections to banks, franchise representatives, or investors.