
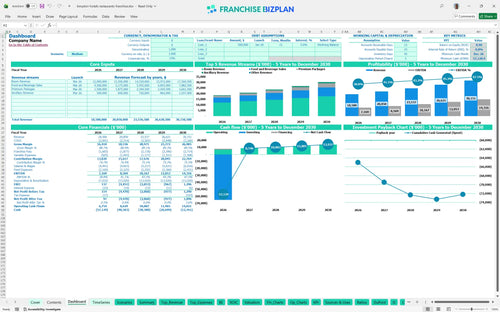
All-in-one Dashboard
Core inputs and core outputs


This franchise unit financial model for business loan applications provides a complete roadmap for estimating food and beverage revenue for hotel franchises alongside core room sales.
Core inputs and core outputs
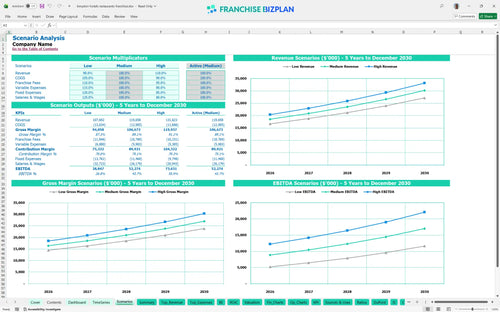
Three scenario analysis
Presentation ready
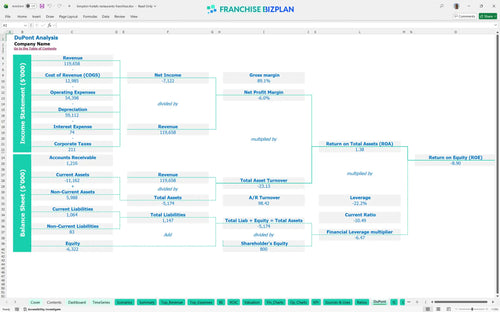
DuPont analysis
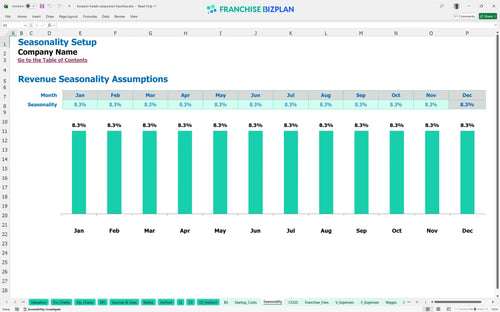
Researched revenue assumptions
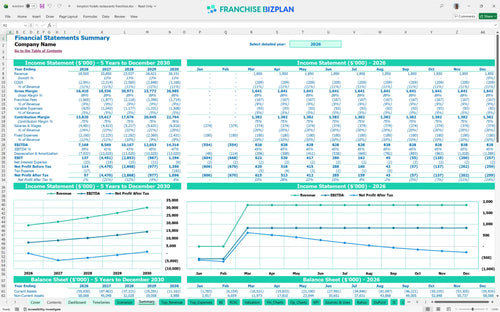
Lender-friendly financial outputs
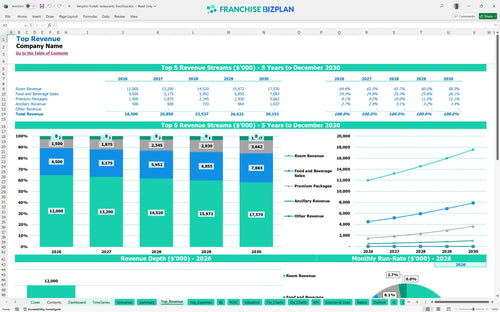
Revenue stream detailed view
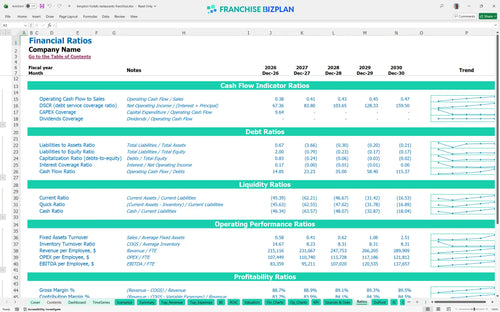
Performance metrics benchmark
We built this boutique hotel financial model using our own research into high-end urban hospitality markets. Key assumptions like the $18.5 million year-one revenue and the $14.3 million year-five EBITDA are pre-populated but fully editable to match your specific location. This tool ensures your franchise investment analysis is based on real-world numbers, not just best-case guesses.
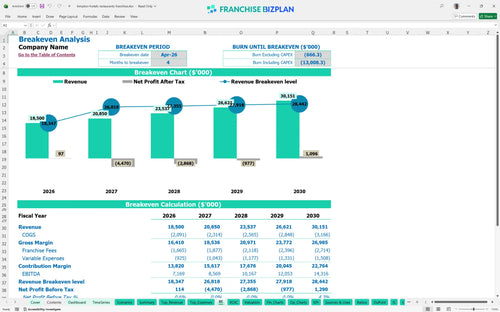
Based on the hotel financial feasibility study, the unit reaches break-even in April 2026, which is only four months after the doors open. While EBITDA is strong at $7.1 million in the first year, the heavy initial debt and CAPEX mean you must manage every point of margin to stay on track. The model shows a steady climb in earnings as your food and beverage sales grow toward $5.2 million by year five.
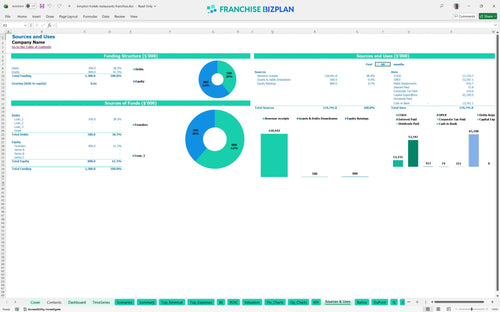
To start this boutique hotel startup budget and expense planning, you need significant capital for the $35 million build-out and $12 million in FF&E (furniture, fixtures, and equipment). Total pre-opening and initial CAPEX exceeds $60 million when you include the rooftop lounge and kitchen equipment. This estimate hides the need for a massive equity injection or a very friendly lender to cover the $1.5 million in pre-opening costs.
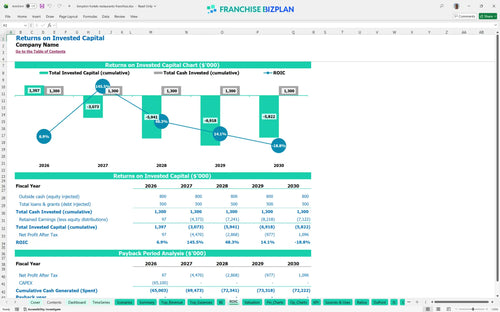
Calculating return on investment for boutique hotel ventures shows a payback period extending beyond the five-year mark due to the massive $65 million+ initial spend. With an IRR of -0.79% and an ROE of -8.9 in this specific five-year window, the focus is on long-term asset appreciation and cash flow stability. Still, the year-five EBITDA of $14.3 million suggests the asset value will be substantial for an eventual exit.
The monthly break-even point is reached in month 4, driven largely by the high room revenue forecast of $8 million in the first year. Your ability to cover the $185,000 in combined monthly rent, utilities, and taxes is the primary hurdle for stability. Revenue per available room (RevPAR) is the most critical lever here; if occupancy dips, the fixed cost of the lease and the 81-person staff will strain your cash quickly.
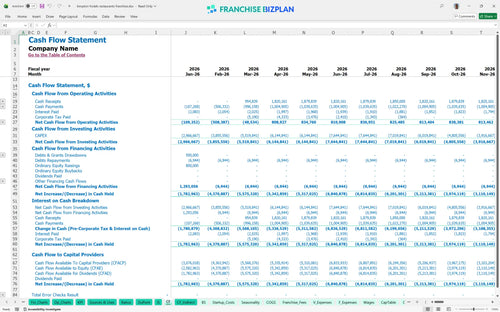
The lowest cash point hits -$57.1 million in December 2026, reflecting the massive upfront CAPEX and the initial ramp-up phase. You defintely need a robust financing plan or a significant equity cushion to survive the construction and initial trading months. Plus, the $35,000 monthly utility bill starts the moment you take the keys, so every day of construction delay burns precious capital.
Pro forma financial statements for hotel franchise owners show that a 10% drop in revenue significantly delays the break-even date and increases the peak cash need. Conversely, hitting the high case improves the year-1 EBITDA of $7.1 million, which is vital for servicing the debt on a project this size. The boutique hotel franchise profitability projection spreadsheet allows you to toggle these scenarios to see the impact on your ROE.
This boutique hotel financial model is built in Excel with open formulas, so you can tweak every assumption to fit your specific market. Whether you are adjusting room rates or food costs, the editable inputs allow you to mirror your specific territory and local demand without fighting the software. Every line item is transparent, making it easy to see how a shift in occupancy changes your bottom line.

Planning for a hospitality franchise business plan requires a long-term view of cash flow and debt service. This model provides a detailed 5-year revenue forecast, showing growth from $18.5 million in year one to over $30.1 million by year five. It gives you a clear look at how the unit scales once it moves past the initial ramp-up phase. Honestly, the five-year view is the only way to see the true potential of this asset class.

Operating a luxury brand means managing high-stakes franchise royalty fees and marketing fund contributions that eat into your top line. This tool tracks the 6% royalty and 3% marketing fee against your gross sales to show the true store-level margin after brand obligations. Here's the quick math: at $20 million in sales, you are sending $1.8 million to the franchisor before you even pay for laundry or labor.

Use this hotel startup cost template to map out the heavy lifting, from $35 million in leasehold improvements to the $100,000 initial fee. It calculates the exact sales volume needed to cover your $85,000 monthly rent and other fixed costs like property taxes and insurance. Knowing your break-even point is the difference between a controlled launch and a cash-flow crisis.

We included hotel profit margin analysis benchmarks to help you sanity-check your operating expense forecast against industry standards. If your guest amenities costs drift far from the 2.8% target, the model flags it so you can adjust your operational cost breakdown for lifestyle hotel franchises. It is a reality check for your assumptions that keeps your business plan grounded in data.


Simply purchase and download the financial model template, then access it instantly using Microsoft Excel or Google Sheets. No installation or technical expertise required-just open and start working.

Enter your business-specific numbers, including revenue projections, costs, and investment details. The pre-built formulas will automatically calculate financial insights, saving you time and effort.

Leverage the investor-ready format to confidently showcase your financial projections to banks, franchise representatives, or investors. Impress stakeholders with clear, data-driven insights and professional reports.

Leverage the investor-ready format to confidently present your projections to banks, franchise representatives, or investors.