
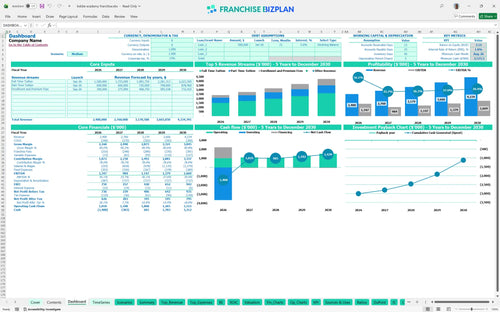
All-in-one Dashboard
Core inputs and core outputs


This franchise financial projection template provides a complete view of your unit's economic health from day one through year five.
Core inputs and core outputs
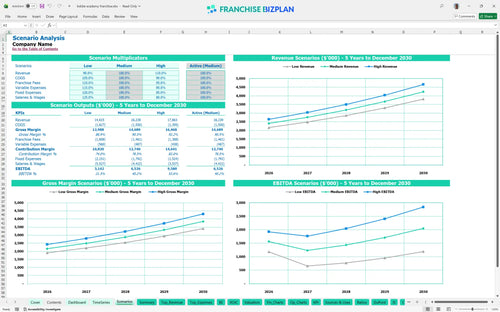
Three scenario analysis
Presentation ready
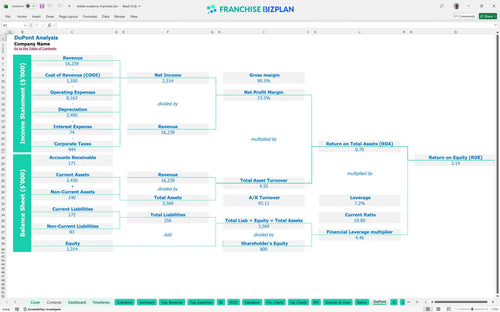
DuPont analysis
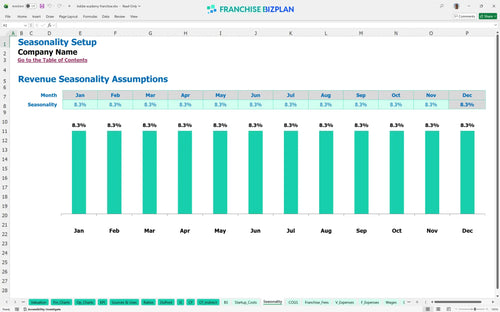
Researched revenue assumptions
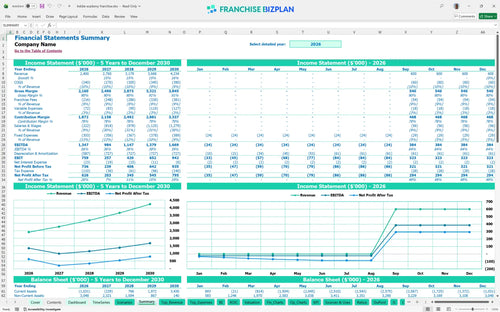
Lender-friendly financial outputs
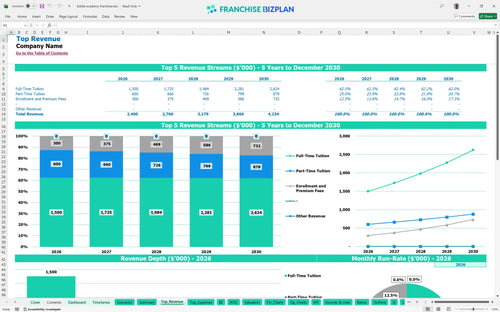
Revenue stream detailed view
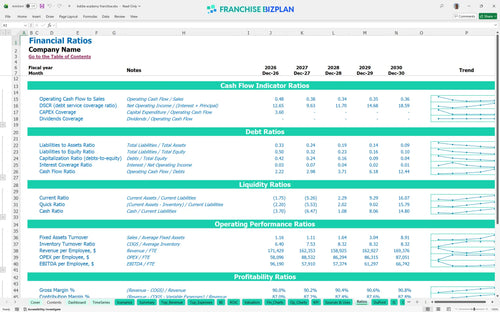
Performance metrics benchmark
We built this preschool franchise financial model using detailed market research to help you evaluate childcare franchise business opportunities. Key assumptions for tuition revenue, staffing for lead teachers, and CAPEX like the $2,000,000 leasehold improvements are pre-populated and fully editable. With a year 1 revenue of $2,400,000 and an EBITDA of $1,347,000, this model provides a credible starting point for your franchise unit financial feasibility study.
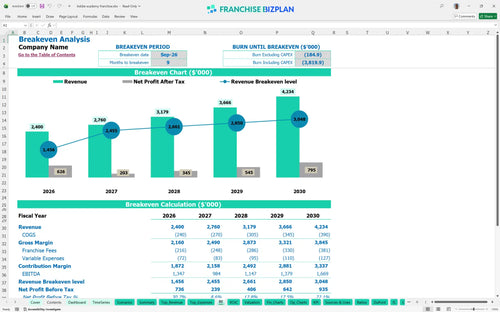
This unit hits its break-even date in September 2026, just nine months after launch. While year 1 EBITDA starts strong at $1,347,000, the model accounts for rising labor costs as you scale from 4 to 8 lead teachers to maintain quality. Profitability depends on maintaining high-status tuition rates while managing a 7% royalty and 2% marketing fee burden.
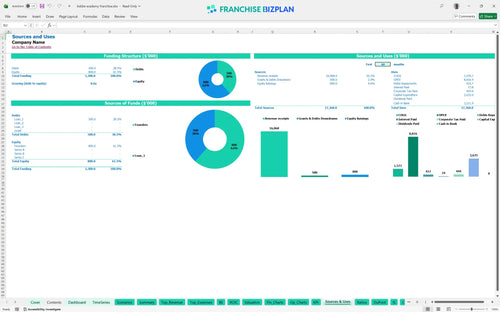
Launching this location in the US requires significant upfront capital, primarily driven by a $2,000,000 leasehold improvement budget. Your total initial outlay also covers the $135,000 franchise fee and $500,000 for outdoor playground equipment to meet brand standards. The model defintely shows that facility costs are your largest hurdle before the first student walks through the door.
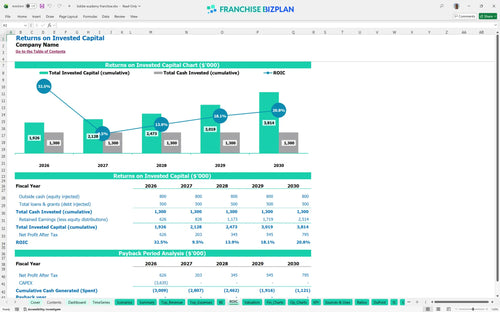
This franchise investment analysis spreadsheet shows an Internal Rate of Return (IRR) of 1.78% and a Return on Equity (ROE) of 3.14%. While the payback period extends after year 5, the steady climb in revenue to $4,234,000 by the fifth year suggests strong long-term asset value. Childcare center ROI is a marathon, not a sprint, relying on high retention and consistent enrollment growth.
You need to reach break-even within 9 months to stay on track with the $20,000 monthly premium facility rent. The biggest driver for this childcare center franchise cash flow projection is enrollment volume, specifically hitting the $1,000,000 full-time tuition mark in year one. If enrollment lags by even 10%, your break-even date will slide into late 2027.
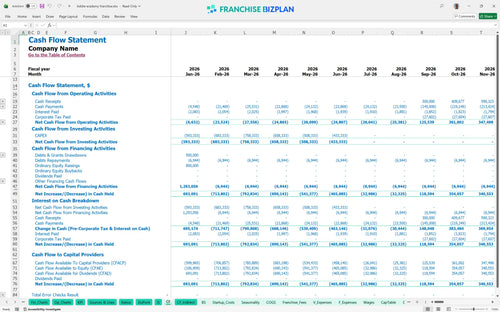
Your lowest cash point occurs in August 2026, with a projected deficit of $2,575,000 before the September break-even. This highlights the need for substantial working capital to cover the gap between construction and full tuition collection. Estimating childcare franchise operating expenses accurately is vital to ensure you don't run out of cash during the final months of build-out.
An early learning center franchise financial forecast must account for different enrollment speeds. Moving to a high scenario significantly improves your year 1 margin by maximizing the $2,400,000 revenue potential early. Conversely, a low scenario increases your peak cash need and could delay your break-even point by several months if fixed costs like the $75,000 director salary aren't managed.
This preschool franchise financial model is built in Excel to give you total control over your numbers. You can swap out pre-filled data for your specific site costs and local market rates, making it easy to test different growth paths. Every formula is open, so you can adjust the educational franchise revenue model as your enrollment grows or staffing needs change.

Planning for the long haul is vital when building a daycare franchise business plan. This model maps out five years of revenue and cash flow, helping you see how enrollment ramps up and when you can expect to see real returns. It provides a clear view of your store-level margins from the first day of classes through a mature five-year operation.

Understanding your franchise fee structure is non-negotiable for accurate budgeting. The model tracks the initial investment plus ongoing 7% royalties and 2% marketing fund contributions to show exactly how much goes to the brand and what stays in your pocket. This ensures your franchise profitability analysis accounts for every contractual dollar owed to the franchisor.

Getting your childcare franchise startup costs right prevents mid-project cash crunches. We break down everything from the $2,000,000 leasehold improvements to classroom furniture, showing the exact sales volume you need to hit to cover your monthly burn. This franchise unit financial feasibility study helps you identify the specific month when your tuition revenue finally covers your fixed costs.

Don't guess your labor or food costs; use our built-in benchmarks to stay competitive. This tool helps you compare your projected preschool business operational expenses against industry standards to ensure your early childhood education franchise investment is on the right track. It helps you sanity-check if your 1.2% payment processing fee or snack costs are in line with top-tier operators.


Simply purchase and download the financial model template, then access it instantly using Microsoft Excel or Google Sheets. No installation or technical expertise required-just open and start working.

Enter your business-specific numbers, including revenue projections, costs, and investment details. The pre-built formulas will automatically calculate financial insights, saving you time and effort.

Leverage the investor-ready format to confidently showcase your financial projections to banks, franchise representatives, or investors. Impress stakeholders with clear, data-driven insights and professional reports.

Leverage the investor-ready format to confidently present your projections to banks, franchise representatives, or investors.