
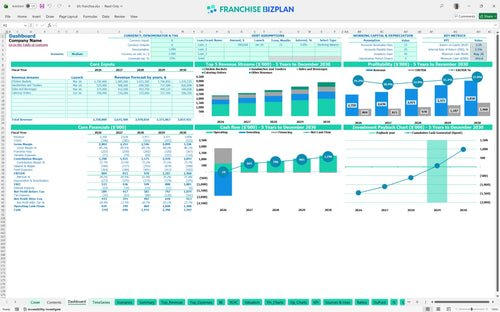
All-in-one Dashboard
Core inputs and core outputs


This franchise P&L statement template provides a granular, month-by-month roadmap of your unit's financial journey from construction through five years of operations.
Core inputs and core outputs
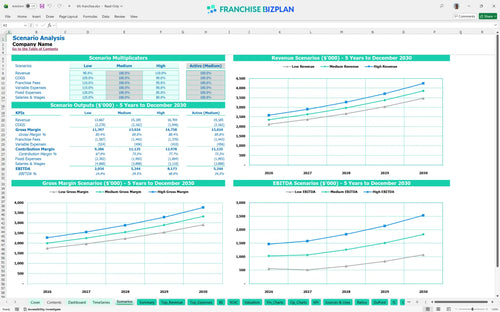
Three scenario analysis
Presentation ready
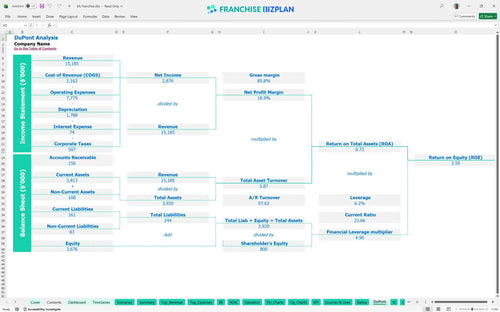
DuPont analysis
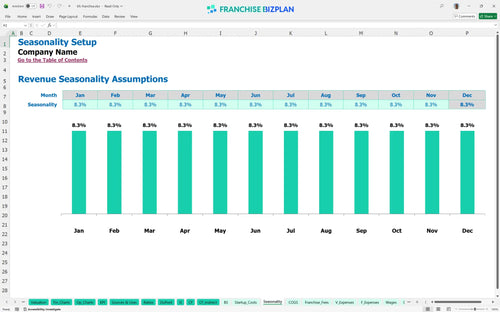
Researched revenue assumptions
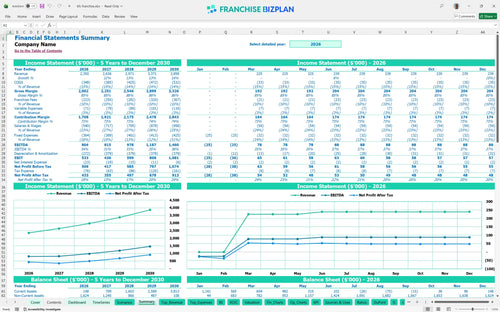
Lender-friendly financial outputs
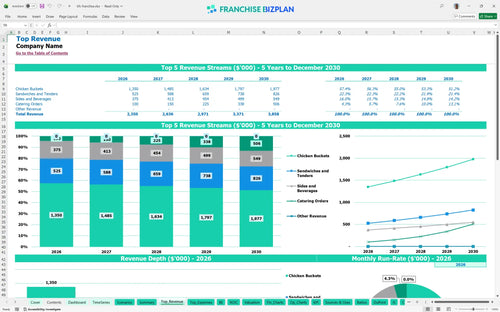
Revenue stream detailed view
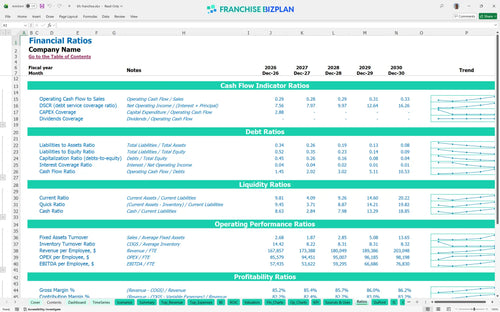
Performance metrics benchmark
We built this financial planning for new franchise store opening tool using detailed research into high-volume fried chicken operations. The assumptions for revenue streams like catering and drive-thru, along with expenses like the $22,000 prime location rent, are pre-populated and fully editable. With a year-one revenue target of $2.35 million, this model gives you a data-driven starting point for your investment.
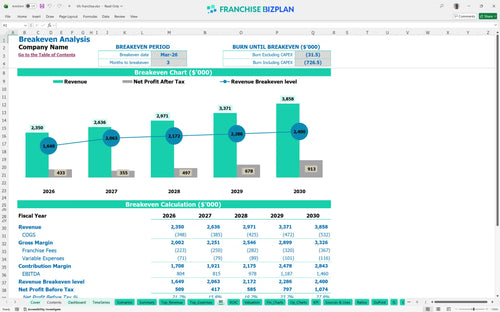
This franchise unit profitability analysis shows the store hits its break-even point in March 2026, just three months after the doors open. By the end of the first full year, you are looking at an EBITDA of $804,000, provided you hit your revenue projection model for quick service franchise targets. Speed is the only currency that matters in a high-volume drive-thru.
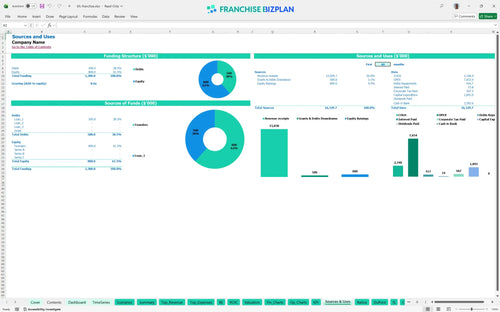
To figure out how to calculate startup costs for a fast food franchise, you have to look at the $1.89 million total spend. This capital expenditure planning includes $650,000 for leasehold improvements and $450,000 for kitchen equipment to meet brand standards. You can't build a next-gen store on a shoestring budget.
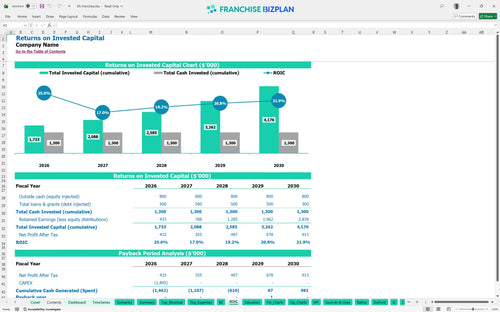
Evaluating franchise investment return on investment requires looking at the 4-year payback period and the 3.53% IRR. While the initial return seems conservative, the ROE of 3.59% and the climb to $1.46 million in year-five EBITDA show the power of a mature location. Equity is a marathon, not a sprint.
The monthly break-even point is reached in month three, but you need to stay on top of estimating operating expenses for a quick service restaurant to keep it there. Your biggest fixed hurdle is the $22,000 rent, so this QSR franchise labor cost optimization template is key to managing your $32,000 crew salaries. Volume hides a lot of operational sins.
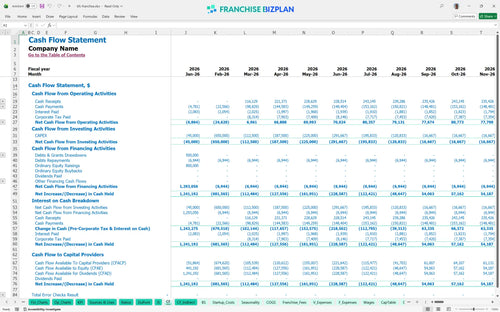
Your lowest cash point hits in August 2026 at negative $242,000, so you defintely need a working capital buffer. This period of operational cash flow forecasting is critical because it marks the gap between high startup costs and the ramp-up of catering revenue. Cash is oxygen; don't hold your breath during the ramp-up.
Developing a business plan for a new franchise location means looking at how a 10% revenue swing impacts your $804,000 year-one EBITDA. High-performance scenarios show revenue pushing toward $3.8 million by year five, which drastically improves your payback timing and cash runway. Execution beats a spreadsheet every single day.
Finance: update unit break-even and payback model by Friday.
This franchise financial model is built in Excel to give you total control over your unit economics. You can swap out pre-filled research for your specific local data, adjusting everything from chicken bucket pricing to regional labor rates. It is a financial model template for restaurant franchise unit planning that lets you stress-test your assumptions before signing a lease.

Mapping out your future is easier when you can see the jump from $2.35 million in year-one revenue to $3.85 million by year five. This tool acts as a multi-unit franchise financial forecasting spreadsheet, helping you visualize how scaling from one to five locations changes your overhead. Use the restaurant business plan Excel features to track how your margins evolve as your store matures in the market.

Franchise costs can eat your margin if you don't track them precisely. This model applies the 5% royalty fee structure and 4.5% marketing fund contribution directly to your gross sales, so you see the net impact on your bottom line. It simplifies the math of ongoing brand obligations, ensuring your operational cash flow forecasting stays realistic and transparent.

Opening a high-volume quick-service unit requires a significant upfront check, and this franchise startup costs template breaks down every dollar. From the initial $45,000 fee to the $650,000 in leasehold improvements, you will know exactly what is needed to reach the starting line. Use the franchise unit break-even analysis calculator to find the exact month your sales cover your $22,000 monthly rent.

Don't guess on your numbers when you can use built-in quick service restaurant unit economics to sanity-check your plan. The model includes typical ranges for food costs and labor, helping you see if your 13% ingredient cost assumption is too aggressive or right on the money. It is the best way to ensure your store-level margin stays competitive with top-tier operators.


Simply purchase and download the financial model template, then access it instantly using Microsoft Excel or Google Sheets. No installation or technical expertise required-just open and start working.

Enter your business-specific numbers, including revenue projections, costs, and investment details. The pre-built formulas will automatically calculate financial insights, saving you time and effort.

Leverage the investor-ready format to confidently showcase your financial projections to banks, franchise representatives, or investors. Impress stakeholders with clear, data-driven insights and professional reports.

Leverage the investor-ready format to confidently present your projections to banks, franchise representatives, or investors.