
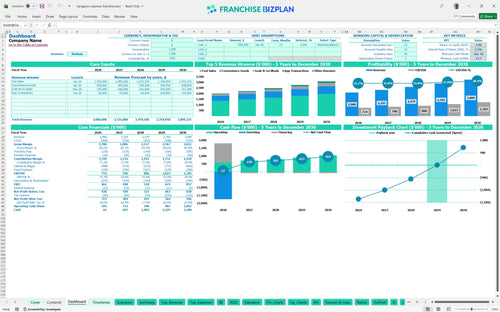
All-in-one Dashboard
Core inputs and core outputs


This Excel template for franchise unit financial planning provides a complete roadmap for estimating profitability for a new franchise unit through detailed revenue, expense, and capital tracking.
Core inputs and core outputs
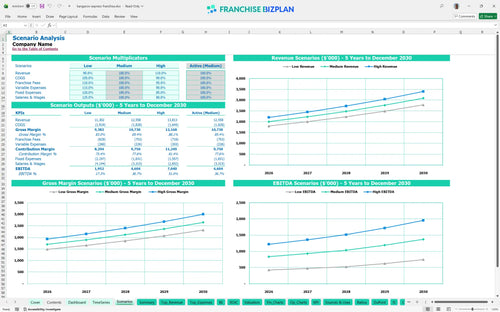
Three scenario analysis
Presentation ready
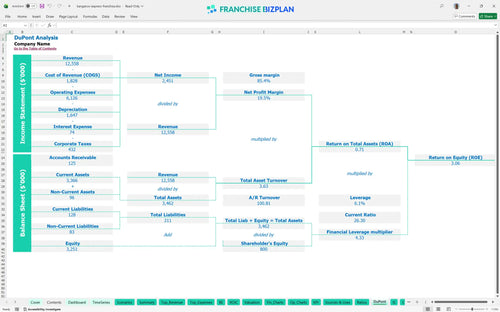
DuPont analysis
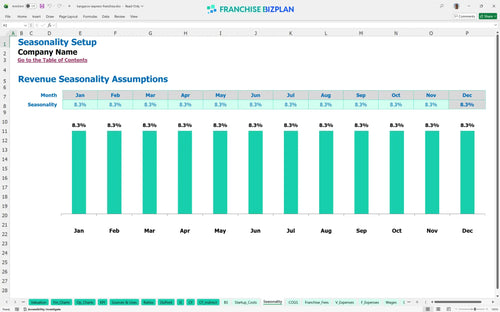
Researched revenue assumptions
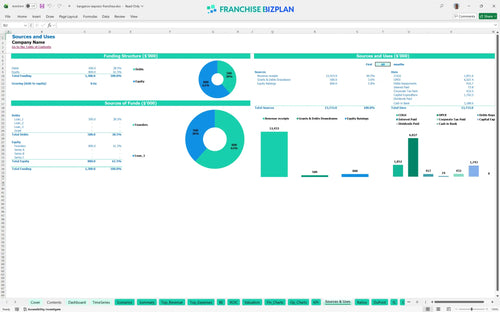
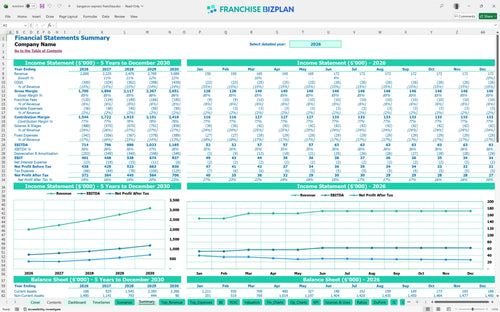
Lender-friendly financial outputs
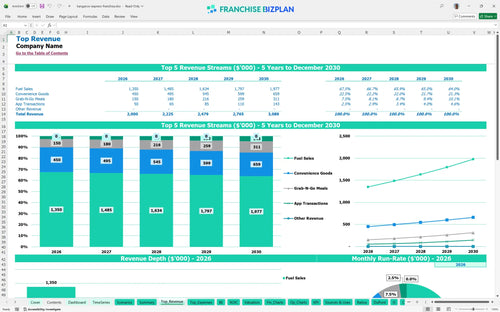
Revenue stream detailed view
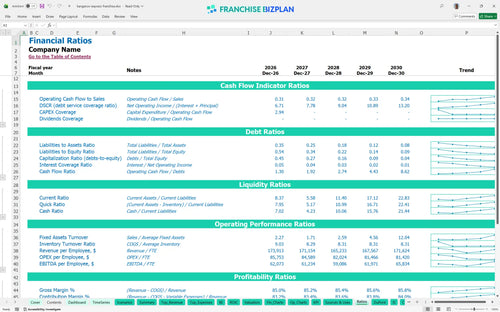
Performance metrics benchmark
We developed this franchise unit financial model through rigorous research into the convenience and fuel retail sector. The assumptions for revenue streams like fuel and grab-and-go meals, along with the $714,000 year-one EBITDA, are pre-populated based on real-world performance data but remain fully editable for your specific Austin-area site. This tool is designed to help you move from a vague business idea to a precise financial forecast for a new franchise.
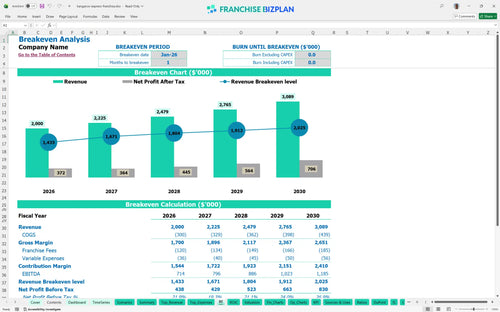
The unit is projected to reach its break-even date in January 2026, which is essentially the first month of operation. You will defintely see strong early performance with a first-year EBITDA of $714,000, scaling to $1,185,000 by year five as app transactions and fresh food sales mature. This rapid path to profit assumes you hit your $2,000,000 year-one revenue target through high-traffic fuel and convenience sales.
To launch this unit in the US, you need a total initial investment of $1,742,500. This capital expenditure analysis covers everything from the $12,500 franchise fee to the $500,000 store buildout and $450,000 for fuel dispensers. You also need to account for a $23,000 minimum cash buffer to handle the lowest point in your ramp-up phase during the first six months of operation.
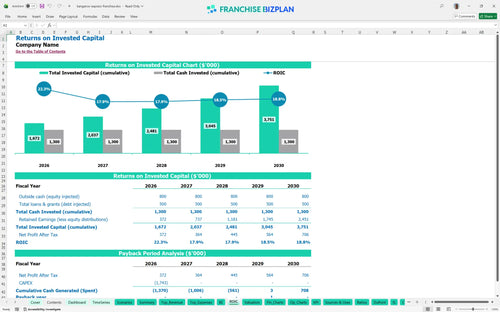
The ROI calculation for franchises shows a 4-year payback period on your initial $1.74M investment. With an Internal Rate of Return (IRR) of 3.46% and a Return on Equity (ROE) of 3.06%, the model suggests steady, long-term wealth creation rather than a quick flip. These figures are based on the unit reaching $3,089,000 in annual revenue by the fifth year of operation.
The monthly break-even point is reached almost immediately in month one due to the high-volume nature of the site. The biggest driver for this is the $18,000 monthly rent and the $27,000+ in initial fixed monthly overhead. To stay above water, you must maintain a high average ticket on convenience goods and steady throughput at the fuel pumps from day one.
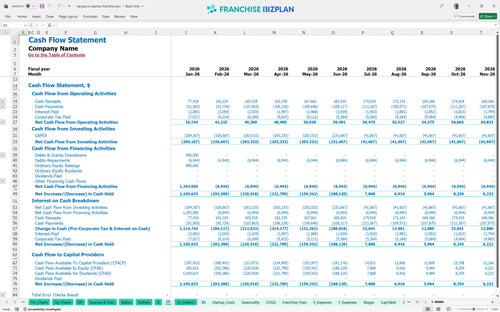
Your lowest cash point occurs in June 2026, where the balance dips to $23,000. This means you have a tight window during the first six months of the ramp-up. While the model shows immediate break-even, any delay in the kitchen equipment installation or a slow start to the 'Fresh & Fast' program could put pressure on that $23,000 buffer, making a slightly larger opening reserve a smart move.
In a High scenario, where you over-perform on app transactions and grab-and-go meals, your year-one margin can exceed the $714,000 EBITDA estimate significantly. Conversely, a Low scenario with higher fuel procurement costs or lower traffic would extend the 4-year payback period and likely require a larger cash injection in June 2026 to stay above the $23,000 minimum cash floor.
Finance: update unit break-even and payback model by Friday
This franchise financial model template is built in Excel to give you total control over your convenience store business plan. You can adjust every line item, from fuel margins to snack prices, ensuring the retail franchise financial projections match your specific territory and local competition. The logic is open, so you can swap out the pre-filled data for your own site-specific quotes without breaking the underlying math.

Planning a gas station franchise startup costs requires a long-term view of how fuel volume and in-store sales grow over time. This model provides a full franchise profit and loss statement across a sixty-month horizon to track your journey from the first gallon sold to a mature, multi-unit operation. You get a clear look at how annual revenue, which starts at $2,000,000, scales alongside your operational cash flow forecasting.

Analyzing franchise royalty and fee structures is vital because these off-the-top costs directly impact your store-level margin. This tool automatically calculates the 5.5% royalty and 0.5% marketing fund contributions against your projected sales, so you see the exact dollar amount leaving the business every month. It simplifies the complexity of franchise unit economic model planning by separating brand costs from local operating overhead.

Knowing how to calculate startup costs for a gas station franchise is the difference between a successful launch and a cash crunch. The model aggregates your initial $12,500 franchise fee, $500,000 store buildout, and $450,000 fuel equipment into a total capital requirement. This feeds directly into a break-even analysis for retail, showing you the exact monthly volume needed to cover your $18,000 prime location rent and labor costs.

We have integrated financial feasibility study for convenience retail standards to help you validate your assumptions. If your fuel procurement costs or merchandise margins drift too far from the 11.5% or 3.5% targets, the model helps you identify where the leak is happening. These benchmarks act as a reality check for your retail franchise unit operating expense budget, ensuring your staffing and utility projections stay within profitable ranges.


Simply purchase and download the financial model template, then access it instantly using Microsoft Excel or Google Sheets. No installation or technical expertise required-just open and start working.

Enter your business-specific numbers, including revenue projections, costs, and investment details. The pre-built formulas will automatically calculate financial insights, saving you time and effort.

Leverage the investor-ready format to confidently showcase your financial projections to banks, franchise representatives, or investors. Impress stakeholders with clear, data-driven insights and professional reports.

Leverage the investor-ready format to confidently present your projections to banks, franchise representatives, or investors.