
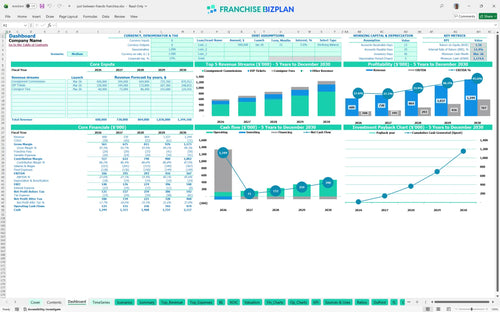
All-in-one Dashboard
Core inputs and core outputs


This comprehensive Excel tool includes detailed revenue drivers, staffing plans, and cash flow trackers specifically designed for seasonal consignment operations.
Core inputs and core outputs
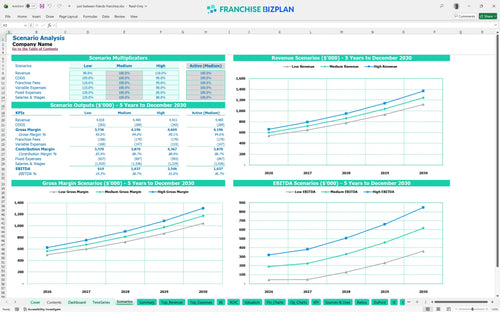
Three scenario analysis
Presentation ready
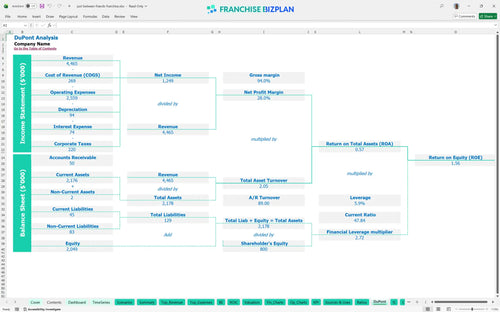
DuPont analysis
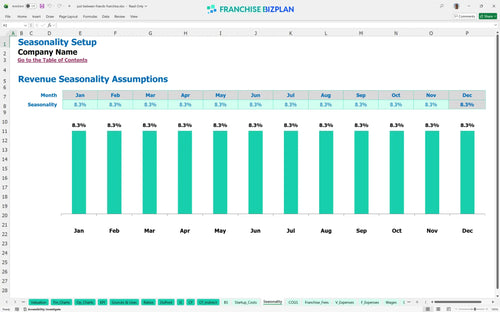
Researched revenue assumptions
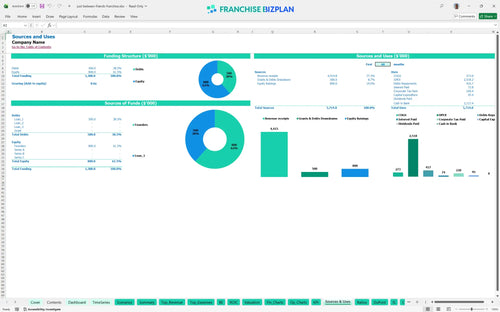
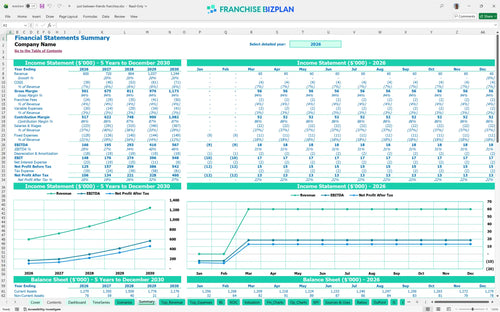
Lender-friendly financial outputs
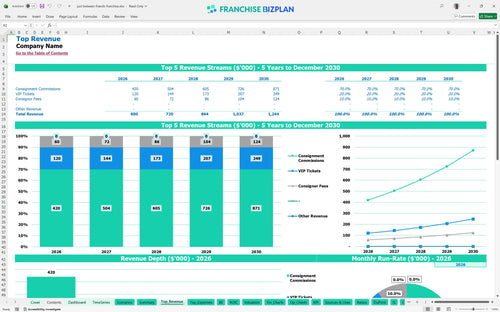
Revenue stream detailed view
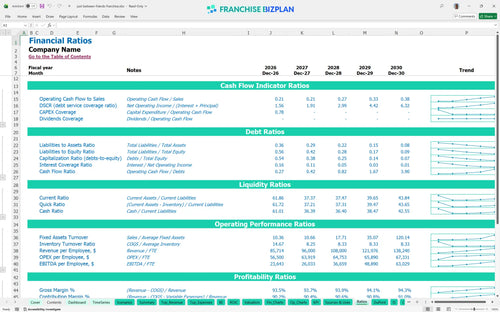
Performance metrics benchmark
We built this franchise unit financial model using our own research into the consignment event space. Key assumptions like the 3% royalty, $6,000 venue rent, and VIP ticket revenue are pre-populated and fully editable to match your specific market. With a year-one EBITDA of $166,000, this model helps you validate if the local demand in your territory supports the investment.
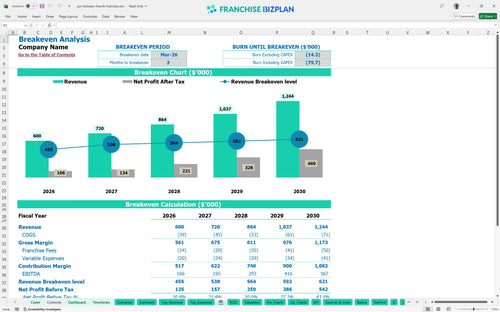
You can expect to reach profitability by March 2026, just three months after your initial launch. This rapid trajectory is driven by high-margin revenue streams like VIP tickets and consignor fees that offset the $132,000 annual management payroll. Profit is a habit, not an accident.
To get this unit off the ground, you'll need roughly $95,400 in startup capital requirements, plus a working capital buffer. This covers your $24,900 franchise fee and $20,000 for essential event equipment like racks and booths. Cash is oxygen; don't start the fire without it.
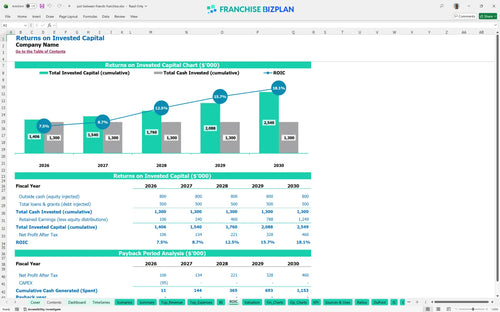
This unit shows an Internal Rate of Return (IRR) of 12.37% and a Return on Equity (ROE) of 1.56. While the full payback period extends beyond year five, the cash flow is strong, with year-five EBITDA hitting $567,000. Returns are the only reason we're here.
Your monthly break-even depends heavily on controlling the $6,000 venue rental and the 3.3% combined processing and platform fees. Because this is a seasonal event business, hitting your revenue targets during the three-month ramp-up is critical. Break-even is the finish line of the startup phase.
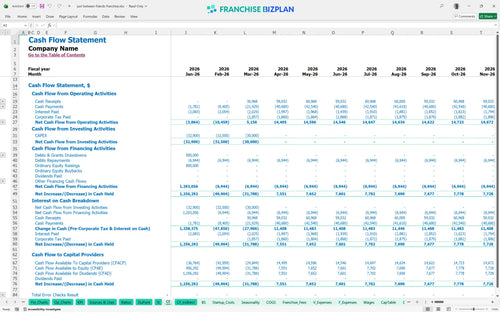
The model identifies March 2026 as your lowest cash point, with a minimum cash balance of $1,175. This means your cash runway is tight during the first 90 days of setup and marketing. You defintely want to have a small contingency fund to handle any delays. Runway is your margin for error.
Our Excel template for franchise unit operating budget allows you to toggle between performance levels to see how a 10% revenue drop impacts your ROE. In a high-growth scenario, your year-one margin expands significantly, while a low-growth case might require more working capital. Scenarios are your financial fire drills.
This franchise financial model template is built in Excel, meaning you aren't stuck with hard-coded numbers. You can swap out the pre-filled assumptions for your specific territory or venue size to see instant results. You control the inputs, so you control the clarity.

Success in seasonal retail requires looking past the first event to understand long-term viability. This franchise business plan spreadsheet provides a full 5-year revenue stream projection, starting at $600,000 in year one and scaling to over $1.2M as your local database grows. Five years is the difference between a job and an asset.

We've baked in the 3% franchise royalty fees and 1% marketing fund contributions so you see the net impact on your margins. By accounting for the $24,900 initial franchise fee and ongoing payments, this tool ensures you understand the real cost of the brand's support. Fees are the price of a proven shortcut.

Launching a consignment store financial projection requires knowing your 'all-in' number before doors open. This model calculates your small business startup cost model, including the $20,000 for racks and $15,000 for POS systems, to find your break-even analysis point. Knowing your zero-point is the first step to profit.

This franchise unit profitability calculator uses built-in benchmarks to help you sanity-check your operating expense forecast against industry standards. It compares your event processing supplies-starting at 5.5% of sales-to typical retail pop-up event metrics. Benchmarks keep your ego in check and your bank account full.


Simply purchase and download the financial model template, then access it instantly using Microsoft Excel or Google Sheets. No installation or technical expertise required-just open and start working.

Enter your business-specific numbers, including revenue projections, costs, and investment details. The pre-built formulas will automatically calculate financial insights, saving you time and effort.

Leverage the investor-ready format to confidently showcase your financial projections to banks, franchise representatives, or investors. Impress stakeholders with clear, data-driven insights and professional reports.

Leverage the investor-ready format to confidently present your projections to banks, franchise representatives, or investors.