
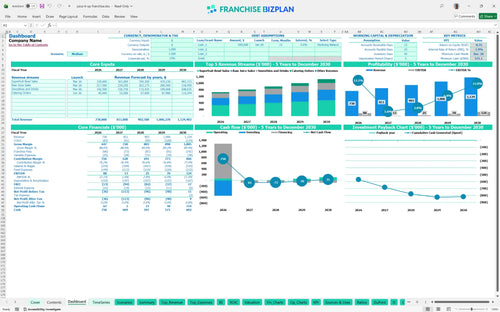
All-in-one Dashboard
Core inputs and core outputs


This franchise investment calculator provides a comprehensive, data-driven framework to forecast revenue, manage expenses, and evaluate the long-term ROI of a health-focused retail unit.
Core inputs and core outputs
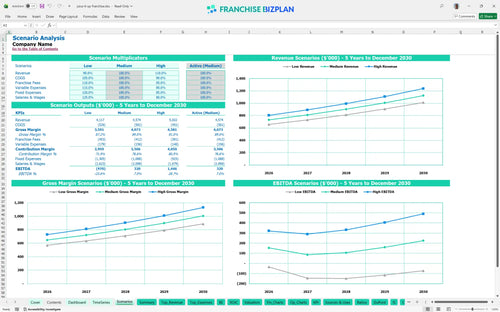
Three scenario analysis
Presentation ready
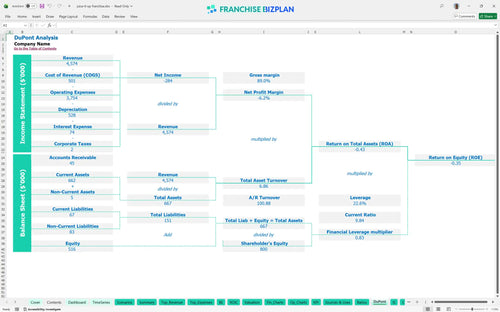
DuPont analysis
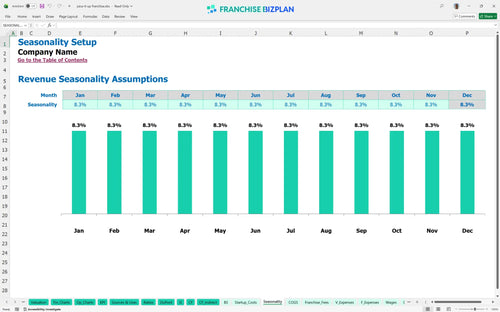
Researched revenue assumptions
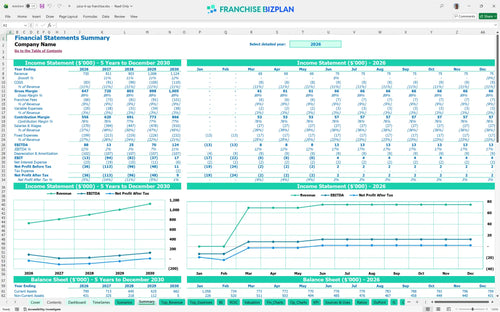
Lender-friendly financial outputs
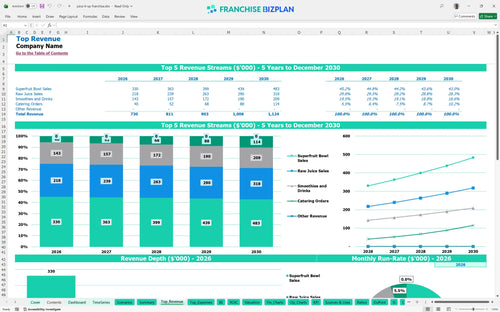
Revenue stream detailed view
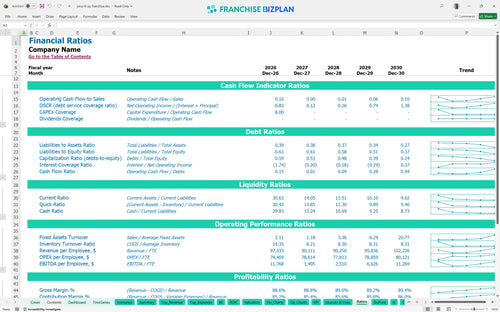
Performance metrics benchmark
We built this franchise unit financial model using deep-dive research into the juice and smoothie sector to ensure your planning is grounded in reality. Key assumptions like the $11,500 monthly rent, 6% royalty fees, and $105,000 equipment packages are pre-populated and fully editable to match your specific site. With Year 1 revenue projected at $730,000 and a 4-month window to operational break-even, this tool helps you navigate the tight margins of the health food world.
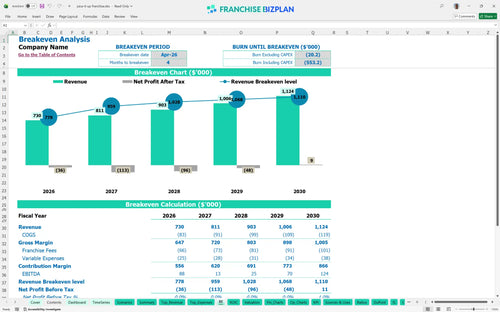
The unit reaches an operational break-even in April 2026, just four months after launch. While Year 1 EBITDA is $88,000, profitability dips in Year 2 to $13,000 due to increased staffing before climbing back to $124,000 by Year 5. Still, the high initial costs mean net profit stays thin in the early years.
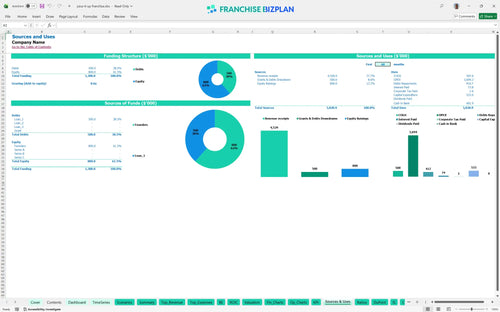
You will need significant capital to launch, with the model showing a minimum cash need of $571,000 by late 2029 to sustain the full cycle. The primary uses include $240,000 for leasehold improvements, $105,000 for cold-press equipment, and the $30,000 initial franchise fee. Build-out and equipment represent the bulk of your upfront cash outlay.
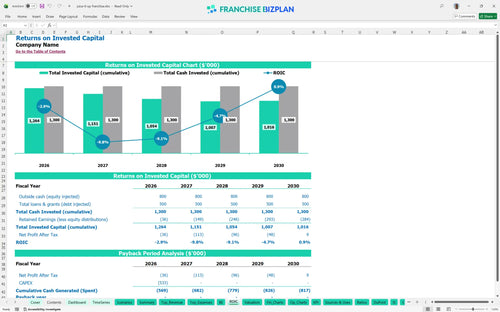
The franchise investment analysis for health food businesses indicates a challenging start, with an IRR of -1.86% and a payback period extending beyond Year 5. While Year 5 revenue hits $1.12 million, the high $11,500 monthly rent and $240,000 build-out pressure the long-term ROI calculator results. This model shows that efficiency is not optional; it is required for survival.
The monthly break-even occurs in month 4, driven by the need to cover $13,400 in fixed costs plus the 9% royalty and marketing burden. Estimating profitability for a new franchise unit depends heavily on maintaining food ingredient costs below 9.2% while driving high morning traffic. If sales volume lags, the high fixed rent becomes a major weight.
The lowest cash point occurs in December 2029, with a projected minimum cash balance of $571,000. This suggests that while the unit is operational, the heavy upfront CAPEX and Year 2 margin compression require a deep liquidity reserve to avoid defintely running out of steam. You need to watch your cash runway closely during the Year 2 staffing ramp-up.
Using the financial model template for smoothie and juice business, a High scenario focuses on revenue projections for a new smoothie shop location exceeding $1.12M early. Conversely, a Low scenario with higher labor or food costs could push the already negative IRR further down, potentially delaying payback indefinitely. Small changes in the 2.2% packaging cost or 6% royalty can shift your peak cash need significantly.
This franchise unit financial model is a fully customizable Excel tool designed to handle the specific unit economics of a high-volume juice bar. You can swap out the pre-filled assumptions for your specific territory, adjusting everything from local labor rates to the exact cost of superfruit ingredients. It is built for the realist who needs to see how a 1-point shift in food waste or a delay in leasehold improvements affects the bottom line. Plus, the editable formulas mean you can model different store footprints without starting from scratch.

Mapping out healthy food franchise financial projections requires looking past the grand opening to see the long-term horizon. This model tracks revenue scaling from $730,000 in year one to over $1.1 million by year five, accounting for the gradual ramp-up of catering orders and superfruit bowl sales. It provides a full profit and loss statement for franchises, so you can see exactly how margins evolve as you add shift leaders and crew members to handle higher throughput. Honestly, the five-year view is the only way to see if the initial build-out debt actually clears.

Managing the ongoing 6% royalty and 3% marketing fund contribution is critical for maintaining your store-level margin. This tool automates those calculations based on your monthly sales, ensuring you never miscalculate the franchisor's cut before covering your own prime location rent of $11,500. It is a detailed breakdown of franchise operating expenses that keeps your cash flow expectations honest and your bank account prepared. Every dollar sent to corporate is a dollar not in your pocket, so tracking these is vital.

Knowing how to calculate startup costs for a juice bar franchise is the first step to avoiding a mid-construction liquidity crunch. The model aggregates $240,000 in leasehold improvements, $105,000 in specialized juicing equipment, and the $30,000 initial fee to show your total entry price. Calculating break-even point for a retail food franchise becomes much simpler when you can see the exact month where revenue finally covers the bills. Most owners underestimate pre-opening labor, but this model keeps those numbers front and center.

We have baked in unit economics analysis based on real-world health food standards, like food ingredients starting at 9.2% of sales. This helps you sanity-check your own estimates for things like delivery platform commissions at 2.2% or general liability insurance at $650 a month. If your local labor costs for crew members deviate from the $27,000 annual average, you will see the impact on your store-level EBITDA (earnings before interest, taxes, depreciation, and amortization) immediately. Use these benchmarks to see if your manager's $64,000 salary is in line with the market.


Simply purchase and download the financial model template, then access it instantly using Microsoft Excel or Google Sheets. No installation or technical expertise required-just open and start working.

Enter your business-specific numbers, including revenue projections, costs, and investment details. The pre-built formulas will automatically calculate financial insights, saving you time and effort.

Leverage the investor-ready format to confidently showcase your financial projections to banks, franchise representatives, or investors. Impress stakeholders with clear, data-driven insights and professional reports.

Leverage the investor-ready format to confidently present your projections to banks, franchise representatives, or investors.