
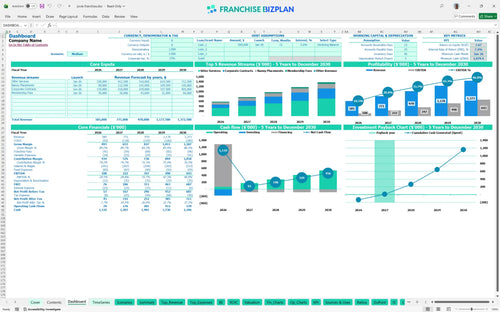
All-in-one Dashboard
Core inputs and core outputs


This Excel template for franchise unit financial forecasting includes pre-built revenue drivers, detailed expense trackers, and a full set of 5-year financial statements.
Core inputs and core outputs
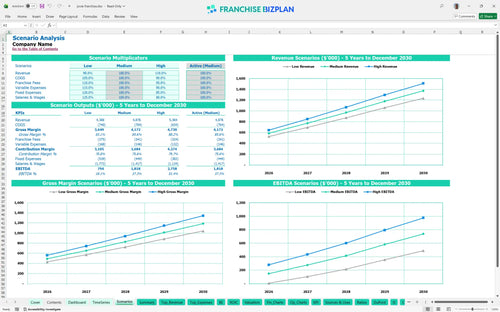
Three scenario analysis
Presentation ready
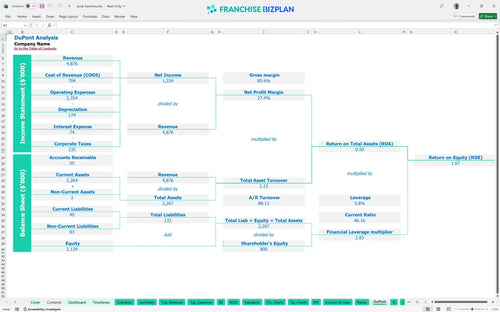
DuPont analysis
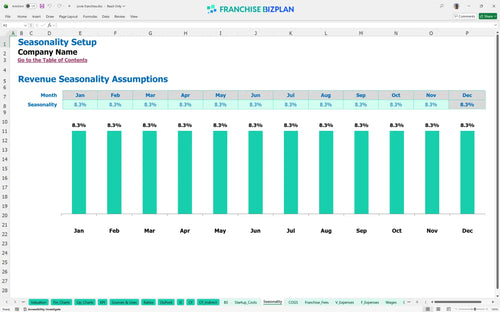
Researched revenue assumptions
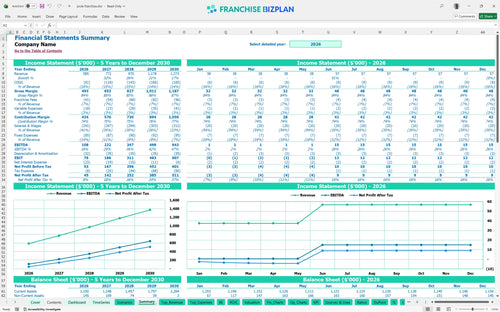
Lender-friendly financial outputs
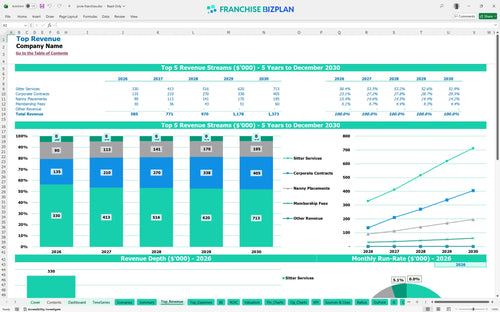
Revenue stream detailed view
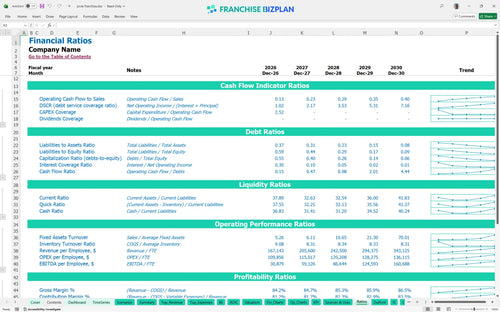
Performance metrics benchmark
We built this childcare franchise business plan using research into high-end nanny and sitter services to ensure your franchise unit financial projections are accurate. The model comes pre-loaded with data like a $45,000 franchise fee and revenue streams from sitter services and corporate contracts, but you can edit everything. With a year-one EBITDA of $108,000, the numbers show a path to scale if you manage the caregiver pool effectively.
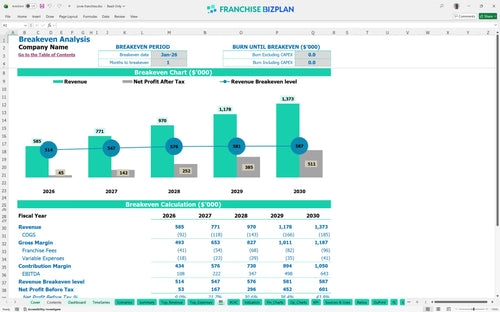
This unit hits the ground running with a projected break-even in January 2026, just one month after launch. By year two, EBITDA jumps to $222,000 as you layer in corporate contracts and membership fees. The math works because fixed costs like the $4,800 rent stay steady while your high-margin revenue streams grow. Profitability is a function of volume and caregiver retention.
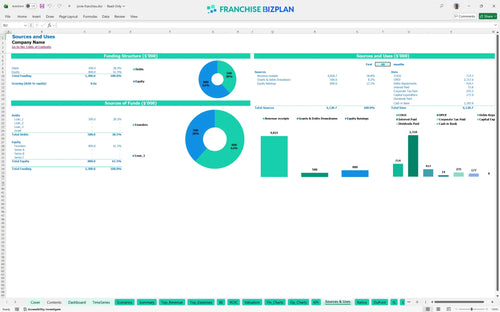
You will need a significant capital stack to get this off the ground, including $45,000 for the franchise fee and $35,000 for office improvements. Total initial costs also cover $28,000 for tech platform customization and $22,000 for computers and servers. Honestly, having a solid cash buffer is vital since the model shows a minimum cash requirement of $1,079,000 to maintain operations through the ramp-up. Knowing how to calculate startup costs for a childcare franchise prevents mid-year funding crises.
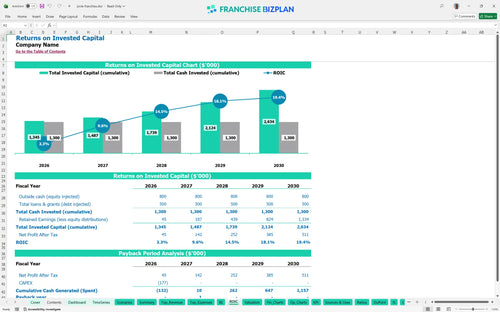
The model projects an Internal Rate of Return (IRR) of 7.24% and a Return on Equity (ROE) of 1.67. You can expect to see your initial investment back in about 2 years based on the current franchise profitability analysis. While the IRR might look modest, the steady climb in EBITDA to $643,000 by year five suggests a very healthy long-term asset. This is a marathon, not a sprint.
You reach the break-even point almost immediately in month one, provided you hit your initial sitter service targets of $220,000 in year one. The main driver here is the volume of sitter hours; since your royalty is a fixed 5%, your ability to cover the $4,800 rent depends entirely on throughput. If you miss your corporate contract launch in June, that break-even safety margin thins out quickly. Break-even analysis is your most important monthly health check.
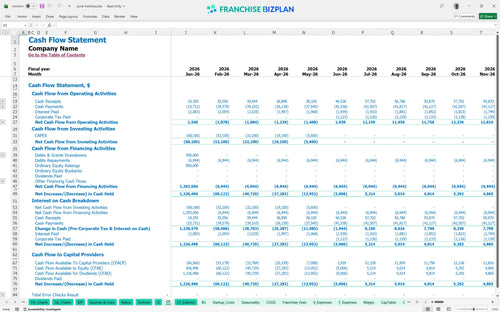
Your lowest cash point is projected for June 2026, which is when those corporate contracts are scheduled to kick in and diversify your revenue. You need enough runway to cover the $186,000 in annual salaries for your GM, Recruiter, and Admin before the revenue fully ramps. Still, keeping an eye on that $1,079,000 minimum cash mark is essential to handle any delays in client payments. Cash flow management is the difference between staying open and closing doors.
The difference between a high and low case usually comes down to caregiver payment percentages, which start at 14% and should drop as you scale. In a high-performance scenario, hitting $1.37 million in revenue by year five significantly boosts your ROE. If revenue lags by 20%, your year-one EBITDA of $108,000 could easily vanish into fixed overhead. Evaluating franchise financial performance metrics across all three scenarios is non-negotiable for serious investors.
Finance: update unit break-even and payback model by Friday.
This franchise financial model template is built in Excel so you can tweak every variable to match your specific territory. You can adjust caregiver pay rates, placement fees, or rent to see how they impact your bottom line. It is a flexible tool that handles the heavy math so you can focus on the strategy of running your unit. Every cell is open, meaning you can change the 14% caregiver payment assumption if your local labor market is tighter.

Planning for the long haul is the only way to see if your childcare franchise business plan actually scales. This model maps out five years of performance, showing revenue climbing from $585,000 in year one to over $1.37 million by year five. You will see exactly how unit economics shift as you move from individual sitter services to high-volume corporate contracts. Long-term success depends on seeing these trends before you sign a multi-unit agreement.

We baked in the specific financial obligations of being a franchisee, like the 5% royalty and 2% marketing fund contribution. These franchise royalty fees are calculated automatically based on your revenue projections, so you know exactly what is leaving the business. It defintely helps to see these 'above the line' costs before you start paying your own local bills. Knowing your true contribution margin is the only way to stay ahead of overhead.

Launching requires more than just the $45,000 franchise fee; you have to account for office improvements and tech customization too. This startup cost calculator for franchises aggregates all your initial CAPEX to show the total check you need to write. It also identifies the exact sales volume needed to stop burning cash and start making it. Most operators fail because they under-estimate the pre-opening ramp-up costs.

Don't guess if your $4,800 monthly rent or 14% caregiver payment rate is normal for this industry. The model includes built-in benchmarks to help you sanity-check your numbers against typical childcare franchise operating cost spreadsheet data. If your labor costs are way off the mark, the model flags it so you can adjust your staffing plan before signing a lease. Real-world data keeps your projections grounded in reality.


Simply purchase and download the financial model template, then access it instantly using Microsoft Excel or Google Sheets. No installation or technical expertise required-just open and start working.

Enter your business-specific numbers, including revenue projections, costs, and investment details. The pre-built formulas will automatically calculate financial insights, saving you time and effort.

Leverage the investor-ready format to confidently showcase your financial projections to banks, franchise representatives, or investors. Impress stakeholders with clear, data-driven insights and professional reports.

Leverage the investor-ready format to confidently present your projections to banks, franchise representatives, or investors.