
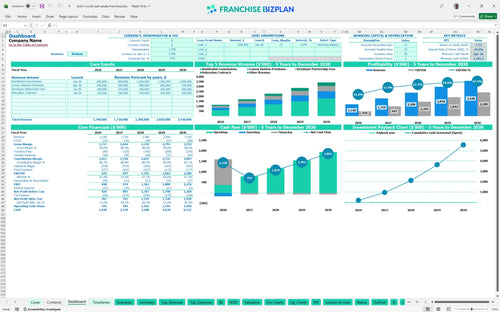
All-in-one Dashboard
Core inputs and core outputs


This comprehensive financial model provides a professional-grade framework for forecasting revenue, managing expenses, and calculating the total investment required for a premium real estate brokerage unit.
Core inputs and core outputs
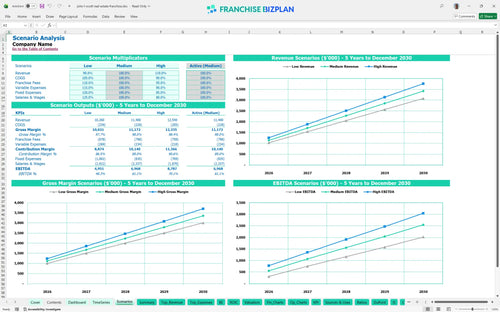
Three scenario analysis
Presentation ready
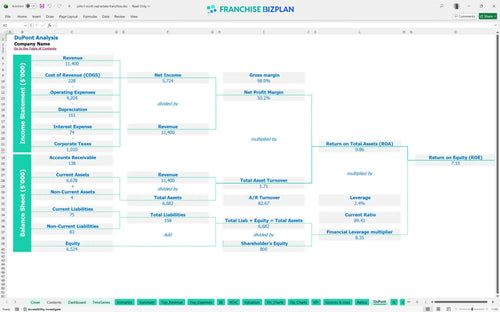
DuPont analysis
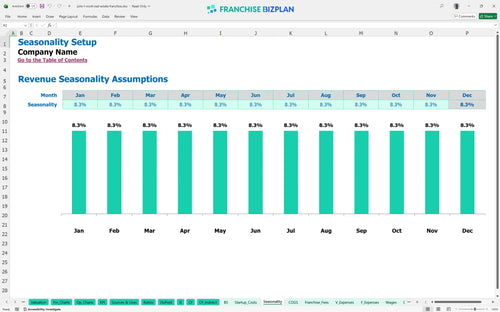
Researched revenue assumptions
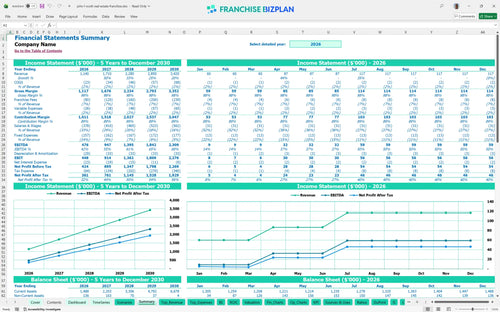
Lender-friendly financial outputs
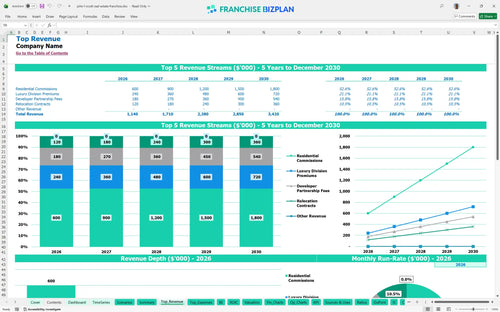
Revenue stream detailed view
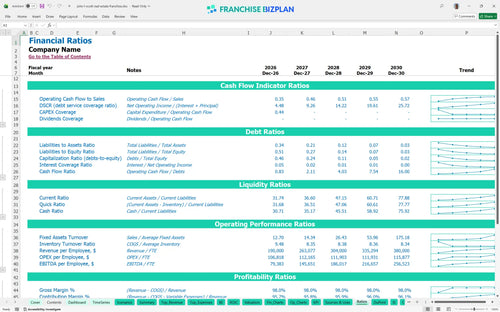
Performance metrics benchmark
We built this real estate franchise financial model based on deep research into premium brokerage operations and market data. The model includes pre-populated assumptions for residential commissions, luxury premiums, and developer fees, all of which are fully editable to match your territory. With a Year 1 EBITDA of $476,000 and a projected Year 5 revenue of $3.42 million, this tool provides the data-driven clarity you need to lead a high-performing office.
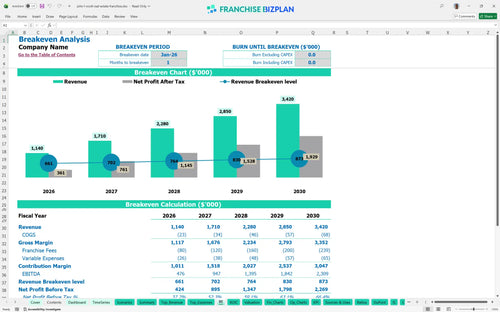
The unit hits its break-even point defintely fast, reaching profitability in January 2026, which is just one month after launch. This rapid turn is driven by high-margin revenue streams like residential commissions and luxury division premiums that offset the initial $165,000 in setup costs. Real estate franchise unit profitability analysis shows EBITDA growing from $476,000 in the first year to over $2.3 million by year five.
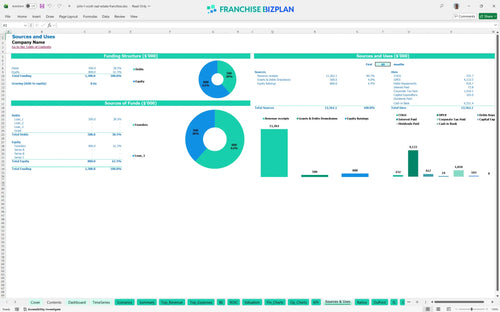
You need a total of $165,000 for physical startup costs plus a significant cash reserve to manage operations. Startup financial projections for residential real estate brokerage indicate the largest outlays are for leasehold improvements at $60,000 and the initial franchise fee of $15,000. Including the minimum cash buffer of $1,165,000, your total liquidity requirement ensures the office can handle the ramp-up period without stress.
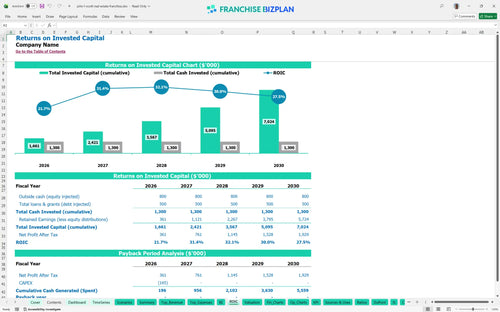
The franchise ROI calculator shows an internal rate of return (IRR) of 24.62%, which is a strong signal for a service-based business. While the model indicates a payback period occurring after year five, this is largely due to the high minimum cash balance maintained for stability. The return on equity (ROE) sits at 7.15, reflecting a stable and maturing business model that prioritizes long-term asset value over quick cash extraction.
The office reaches break-even in its very first month, January 2026, provided the initial residential commission targets are met. A financial feasibility study for real estate franchise operations shows that fixed costs, led by $8,500 in monthly rent and $24,333 in monthly base salaries, are the primary hurdles. Because the royalty is a percentage of sales, the break-even point moves with your volume, but high-ticket luxury sales shorten the path significantly.
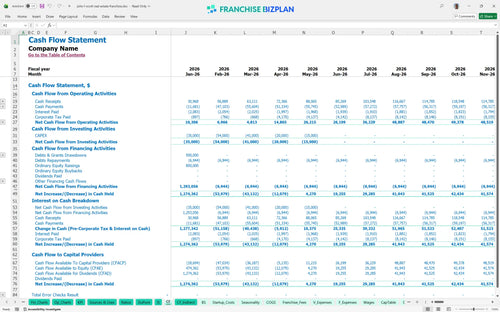
The lowest cash point for the brokerage occurs in April 2026, with a balance of $1,165,000. This suggests that while the unit is profitable quickly, the timing of CAPEX and initial hiring creates a temporary dip in liquidity. Creating a budget for a new real estate franchise office requires planning for this four-month window to ensure all obligations are met before the larger commission checks start flowing consistently.
Forecasting revenue for luxury real estate brokerage requires looking at Low, Medium, and High performance cases. In a High scenario where you capture more relocation contracts and developer fees, Year 1 revenue could exceed the $1.14 million baseline, significantly boosting your IRR. Conversely, a Low scenario with slower luxury adoption would extend the payback period and require a tighter grip on the $292,000 annual payroll for support staff.
Finance: update unit break-even and payback model by Friday
This real estate franchise financial model is built in Excel to give you total control over your numbers. You can adjust every assumption, from agent commission splits to local office rent, ensuring the math fits your specific market. It uses pre-filled formulas so you can focus on strategy rather than building spreadsheets from scratch. This Excel template for franchise unit business planning is the fastest way to stress-test your brokerage ideas.

Success in brokerage requires looking past the first few closings to see the long-term trend. This tool provides detailed real estate brokerage financial projections covering five years of growth, including revenue, expenses, and net profit. You can map out how your cash flow forecasting for real estate changes as you scale from two agents to five or more. It provides a clear view of your balance sheet and long-term equity value.

Operating under a major brand means managing specific financial obligations that impact your bottom line. This real estate franchise profit and loss template tracks the 5% royalty and 2% marketing fund contributions automatically based on your gross commission income. By modeling these costs upfront, you can see how franchise unit performance metrics are affected by brand-related overhead. It ensures you always know exactly what is owed to the franchisor each month.

Launching a new office requires a clear understanding of your total 'all-in' cost before the first door opens. This franchise unit startup cost calculator helps you estimate the $165,000 in capital expenditures (CAPEX) plus the necessary working capital. You will see exactly how to calculate startup costs for a real estate franchise, including leaseholds and IT. The model then identifies the specific sales volume needed to cover your $8,500 monthly rent and other fixed costs.

Don't guess if your $95,000 managing broker salary or your marketing spend is out of line with the industry. This model includes franchise investment analysis tools that compare your projected real estate brokerage operating expenses against common industry standards. It helps you sanity-check your gross margins and labor costs to ensure your plan is realistic. Use these benchmarks to defend your projections to lenders or partners.


Simply purchase and download the financial model template, then access it instantly using Microsoft Excel or Google Sheets. No installation or technical expertise required-just open and start working.

Enter your business-specific numbers, including revenue projections, costs, and investment details. The pre-built formulas will automatically calculate financial insights, saving you time and effort.

Leverage the investor-ready format to confidently showcase your financial projections to banks, franchise representatives, or investors. Impress stakeholders with clear, data-driven insights and professional reports.

Leverage the investor-ready format to confidently present your projections to banks, franchise representatives, or investors.