
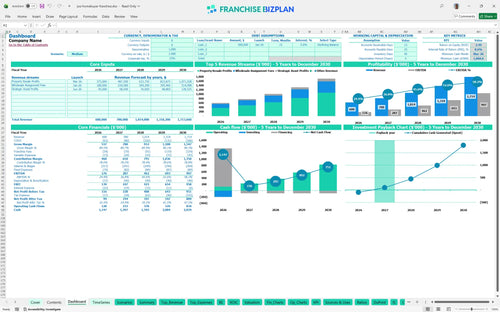
All-in-one Dashboard
Core inputs and core outputs


This franchise unit financial model template provides a complete toolkit for projecting cash flows, evaluating ROI, and managing the specific costs of a real estate investment territory.
Core inputs and core outputs
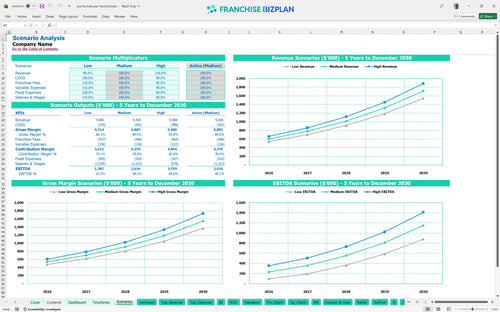
Three scenario analysis
Presentation ready
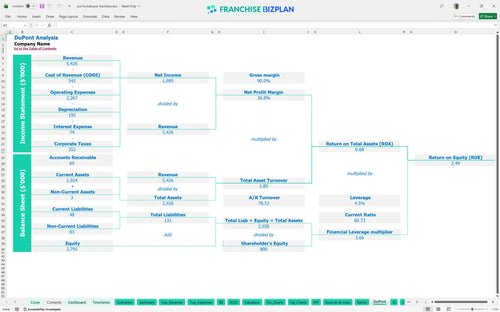
DuPont analysis
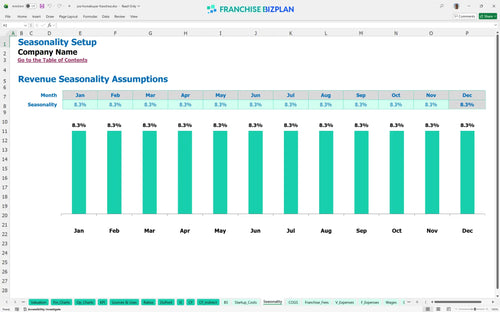
Researched revenue assumptions
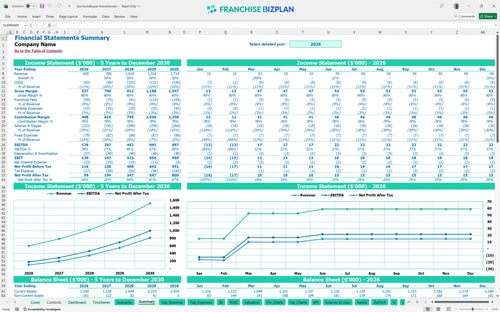
Lender-friendly financial outputs
Revenue stream detailed view
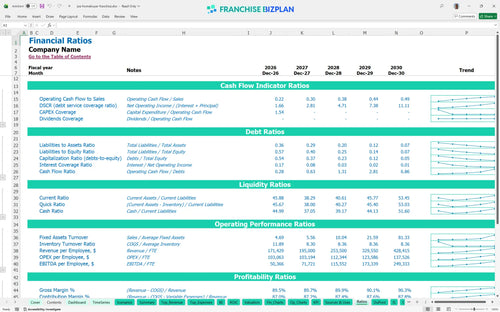
Performance metrics benchmark
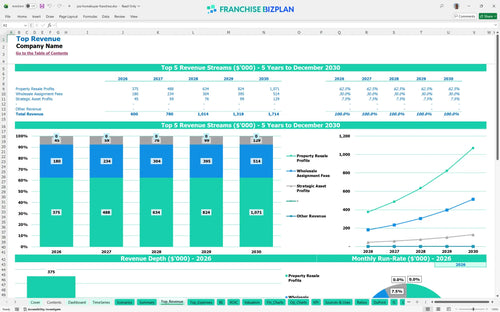
We built this real estate investment franchise unit financial model using our own research on the residential redevelopment sector and preparing a franchise business financial plan. Key assumptions, including the $50,000 franchise fee and 9% royalty, are pre-populated and fully editable for your specific territory. With Year 1 revenue projected at $600,000 and EBITDA hitting $176,000, this tool provides a realistic look at unit economics and cash flow needs.
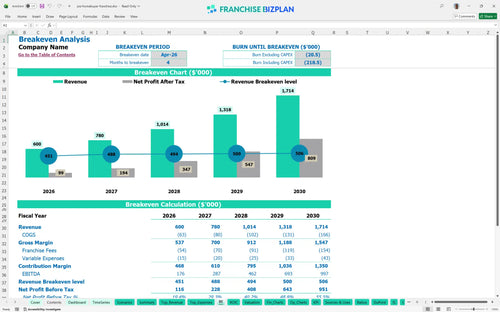
This unit turns a net profit faster than most service businesses, hitting its break-even date in April 2026, just four months after launch. By Year 3, your EBITDA should reach $462,000 as you scale property resale profits and assignment fees. Efficiency in the acquisition funnel is the key driver here. Here is how to calculate profitability for a property flipping franchise effectively.
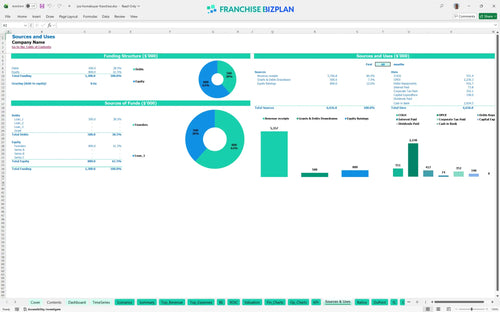
Launching this unit requires $1,061,000 in total capital to safely navigate the ramp-up period through March 2026. This includes the $50,000 franchise fee, $40,000 office fit-out, and $30,000 for a company vehicle, plus a significant cash buffer for property acquisitions. Most of the capital is allocated to property acquisition liquidity to ensure you can make 24-hour cash offers.
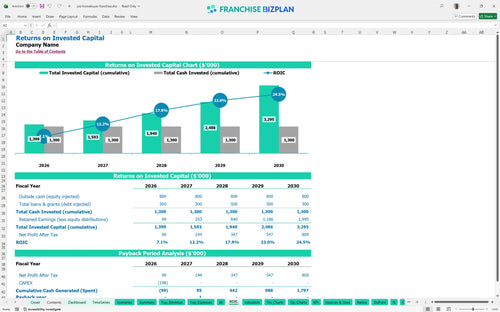
Investors can expect an Internal Rate of Return (IRR) of 8.61% and a 2-year payback period on their initial equity. The model shows a Return on Equity (ROE) of 2.49, with annual revenue scaling toward $1.7 million by the end of Year 5. This ROI analysis for home buying franchise opportunities focuses on long-term equity growth and sustainable cash flow.
The monthly break-even point is reached in month 4, requiring enough volume to cover fixed costs like the $4,000 monthly rent and $6,600 in total overhead. Your ability to hit this defintely depends on the speed of your first property resale and closing cycle. High-frequency digital targeting is the main lever to shorten this window and cover your royalty burden.
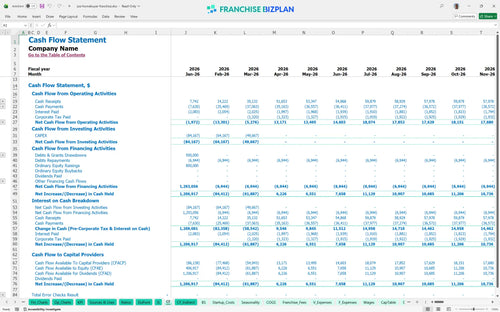
The cash runway is tightest in early 2026, with the lowest cash point of $1,061,000 occurring in March. You should maintain a significant cash buffer to handle property acquisition and holding costs before the first $250,000 in resale profits hits the books. Analyzing cash flow for property acquisition franchises requires disciplined timing on renovations and exits.
The High scenario assumes revenue reaches $1.7 million by Year 5 with improved property acquisition margins of 7.2%. In contrast, the Low scenario accounts for slower ramp-ups in wholesale assignment fees and higher closing costs, which could delay the 2-year payback. This franchise unit performance projection spreadsheet allows you to stress-test these variables before signing a lease. Finance: update unit break-even and payback model by Friday.
This financial model template for residential redevelopment franchise operations is built in Excel with fully editable assumptions and pre-filled formulas. You can easily adjust variables for specific territories, local market conditions, and different property acquisition strategies to see how they impact your bottom line. Flexibility is the difference between a static guess and a working tool.

Plan your multi-year growth with detailed pro-forma financial statements that project revenue, costs, and cash flow through 2030. The model tracks how your real estate investment franchise model scales from a single territory into a mature operation with increasing property resale volume. Five years of data turns a side hustle into a scalable enterprise.

Understanding franchise royalty and marketing fees is critical for maintaining store-level margins in a high-ticket real estate environment. This model accounts for the 9% royalty fee and the initial $50,000 franchise fee, ensuring you see the true net profit after all brand obligations are met. Royalties are a top-line tax; you need to know exactly how they eat your margin.

Use the franchise startup cost calculator to estimate your total initial investment, including office fit-out, vehicles, and valuation software. The model identifies the exact sales volume needed to cover your $6,600 in monthly fixed costs and reach the break-even point. Knowing your zero-profit number is the only way to sleep at night.

The model includes built-in benchmarks for estimating operating expenses for real estate investment units, such as acquisition manager salaries and closing fees. These data points help you sanity-check your projections against industry standards to ensure your labor and occupancy costs stay within a healthy range. Benchmarks keep your assumptions from drifting into fantasy land.


Simply purchase and download the financial model template, then access it instantly using Microsoft Excel or Google Sheets. No installation or technical expertise required-just open and start working.

Enter your business-specific numbers, including revenue projections, costs, and investment details. The pre-built formulas will automatically calculate financial insights, saving you time and effort.

Leverage the investor-ready format to confidently showcase your financial projections to banks, franchise representatives, or investors. Impress stakeholders with clear, data-driven insights and professional reports.

Leverage the investor-ready format to confidently present your projections to banks, franchise representatives, or investors.