
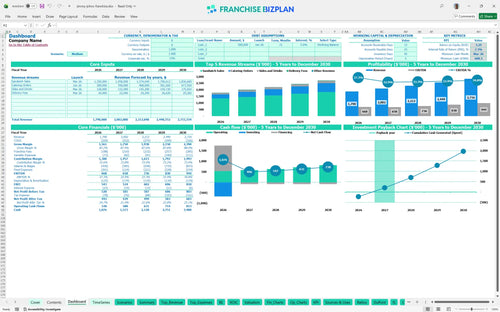
All-in-one Dashboard
Core inputs and core outputs


This comprehensive franchise investment analysis spreadsheet provides a detailed roadmap for managing startup costs, operational expenses, and long-term profit targets for a sandwich shop unit.
Core inputs and core outputs
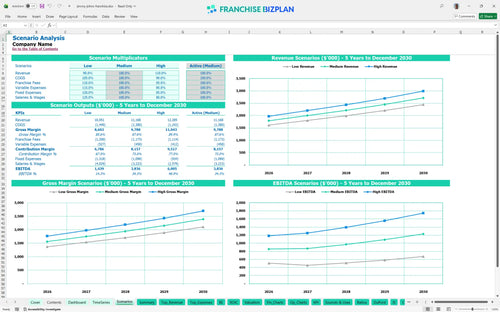
Three scenario analysis
Presentation ready
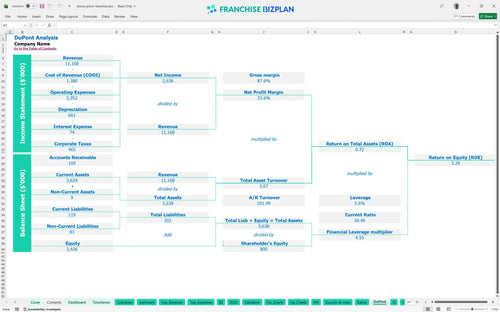
DuPont analysis
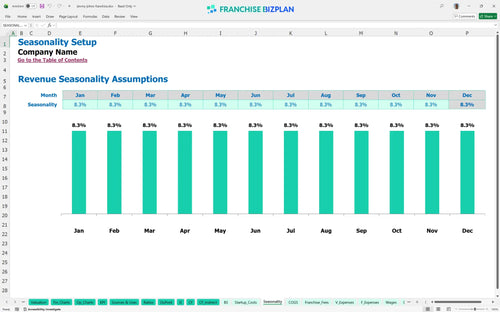
Researched revenue assumptions
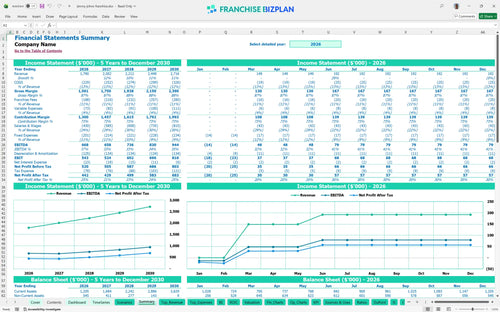
Lender-friendly financial outputs
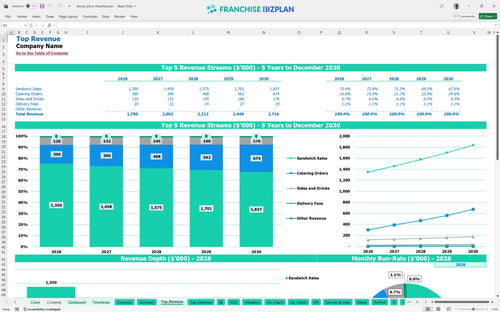
Revenue stream detailed view
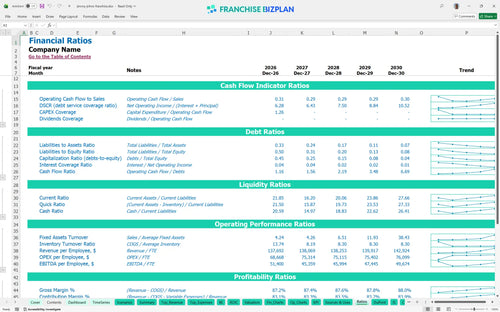
Performance metrics benchmark
We built this sandwich shop financial model using our own research to ensure it reflects the day-to-day reality of the brand. Key assumptions like the $35,000 franchise fee, catering revenue streams, and the 10.5% combined royalty and marketing burden are pre-populated and fully editable. This tool helps you move from 'maybe' to a data-driven 'yes' by showing a year-one EBITDA of $668,000 based on researched performance levels.
This franchise unit is designed for speed, and the profitability analysis shows it hitting a positive net profit defintely by the third month of operation. By the end of year one, the model projects an EBITDA of $668,000 after accounting for all food costs, royalties, and the $12,000 monthly rent. Profitability scales as catering orders grow from $200,000 in year one to nearly $450,000 by year five.
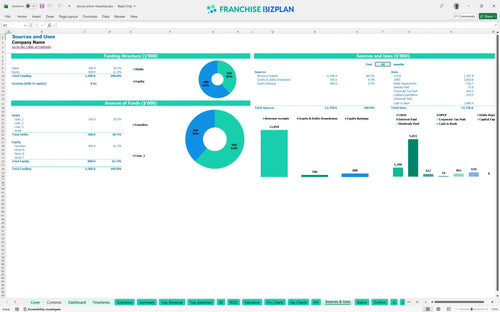
The total initial capital expenditure budget for this unit is approximately $670,000, covering everything from the franchise fee to delivery gear. This Excel template for franchise startup costs shows that leasehold improvements and refrigeration units are your biggest upfront hits. You will need to secure these sources of capital before the March 2026 launch to ensure a smooth build-out.
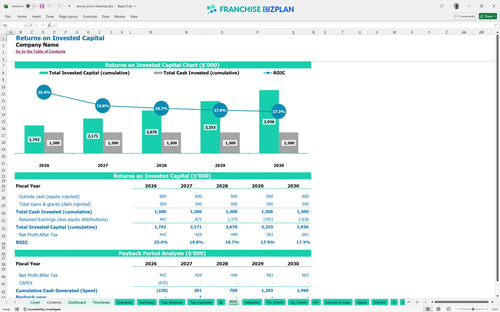
Investors can expect a 7.26% Internal Rate of Return (IRR) with a relatively fast payback period of just 2 years. This is a strong result for a retail food franchise, driven by high throughput and an efficient urban delivery model. The franchise unit profit and loss statement template shows that consistent execution leads to a 3.29 Return on Equity (ROE) as the business matures.
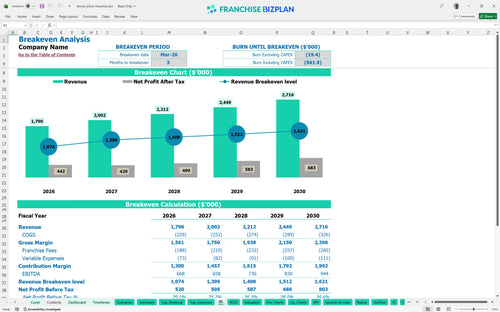
The monthly break-even point is reached in March 2026, just three months after the initial setup begins. Calculating break-even point for food franchise units depends heavily on controlling the 11% food cost and the fixed $12,000 rent. Because the royalty and marketing fees are percentages of sales, your break-even is mostly sensitive to labor productivity and fixed occupancy costs.
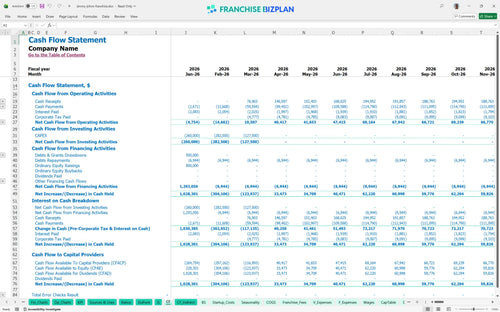
The lowest cash point occurs in March 2026, with a minimum cash requirement of $600,000 to cover the heavy startup phase and initial operating gap. Estimating operating costs for urban delivery franchise units requires accounting for the 'VIP Delivery Squad' wages and bike gear early on. You should maintain a small buffer to handle any delays in the $300,000 leasehold improvement timeline.
Financial forecasting for quick service restaurant units must account for volatility in foot traffic and food prices. In a high-performance scenario, the year-one revenue of $1.79 million could climb faster if catering orders exceed the $200,000 baseline. Conversely, a low scenario might see the 2-year payback stretch to 3 years if labor costs rise above the projected crew member salaries.
This franchise financial model template is built in Excel to give you total control over your numbers. You can edit every formula and assumption, from local labor rates to specific lease terms, ensuring the projections match your exact territory and market conditions. It is a flexible tool designed to handle the moving parts of a high-volume sandwich shop.

Planning for the long term is the only way to scale, and this food service franchise financial projection maps out your path from day one through year five. You get a clear view of how revenue grows from $1.79 million in the first year to over $2.7 million by year five. This helps you manage multi-unit franchise management goals by seeing how cash flow stacks up over time.

The model tracks the specific royalty fee structure that impacts your bottom line every single week. With a 6% royalty and a 4.5% marketing fee built into the calculations, you can see exactly how much goes to the franchisor as your sales climb. This ensures you understand the real unit economics before you sign the agreement.

Using this franchise startup cost calculator, you can estimate the total capital needed to get the doors open and the ovens hot. It breaks down the initial investment into clear categories like leaseholds and equipment. You will know exactly what sales volume you need to hit to cover your $12,000 monthly rent and other fixed overhead.

We have integrated franchise unit economics benchmarks so you can sanity-check your food costs and labor spend. If your food ingredients are projected at 11%, you can compare that against industry norms to ensure your margins stay healthy. This feature helps you spot potential 'margin leaks' in your restaurant franchise business plan before they become real-world problems.


Simply purchase and download the financial model template, then access it instantly using Microsoft Excel or Google Sheets. No installation or technical expertise required-just open and start working.

Enter your business-specific numbers, including revenue projections, costs, and investment details. The pre-built formulas will automatically calculate financial insights, saving you time and effort.

Leverage the investor-ready format to confidently showcase your financial projections to banks, franchise representatives, or investors. Impress stakeholders with clear, data-driven insights and professional reports.

Leverage the investor-ready format to confidently present your projections to banks, franchise representatives, or investors.