
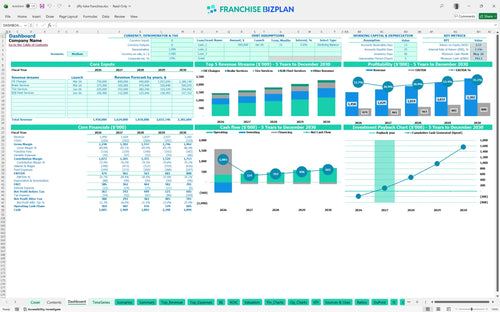
All-in-one Dashboard
Core inputs and core outputs


This financial model template for auto repair business provides a complete set of pro forma statements, including an interactive dashboard and detailed capital expenditure schedules.
Core inputs and core outputs
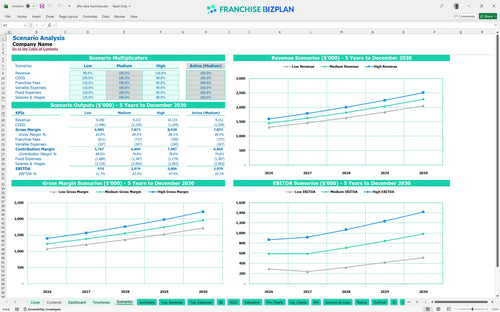
Three scenario analysis
Presentation ready
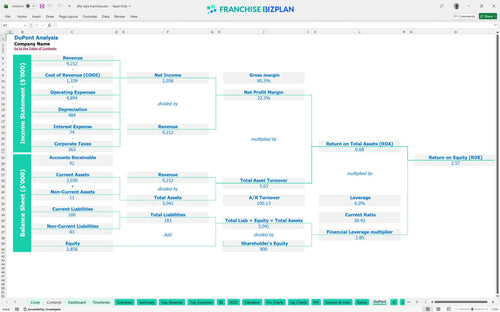
DuPont analysis
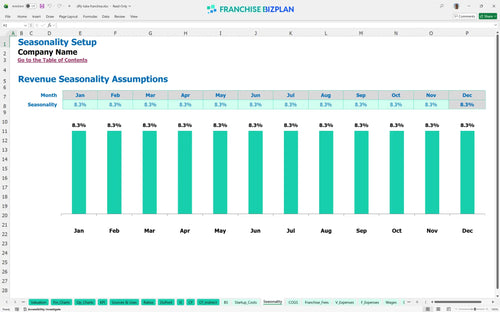
Researched revenue assumptions
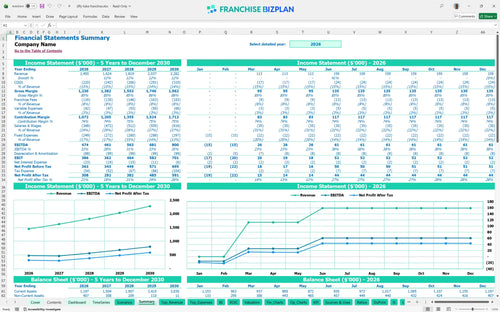
Lender-friendly financial outputs
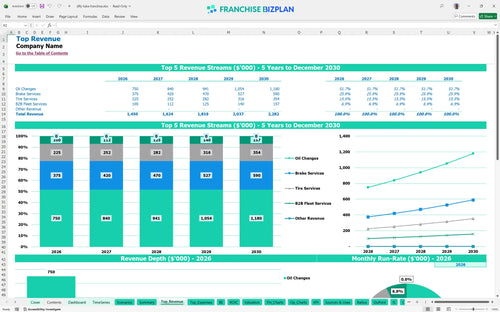
Revenue stream detailed view
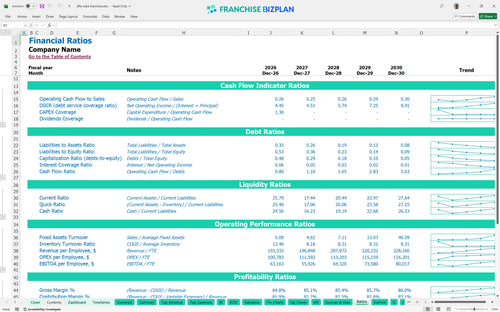
Performance metrics benchmark
We built this franchise unit financial model using our own research to provide a business plan template for multi-service vehicle center operations. Key assumptions like the $1.45M year-one revenue and the 8% combined royalty and marketing fees are pre-populated but fully editable to match your specific territory. This tool allows for accurate estimating revenue for independent automotive franchises or branded units by adjusting service mix and local demand drivers.
The unit reaches profitability in its first year of operation, generating a projected EBITDA of $474,000. By year five, net profit scales significantly as revenue climbs to $2.28M, driven by maturing B2B fleet services and tire sales. These profitability metrics for automotive service centers show that while year two sees a slight EBITDA dip due to staffing increases, the long-term margin remains strong.
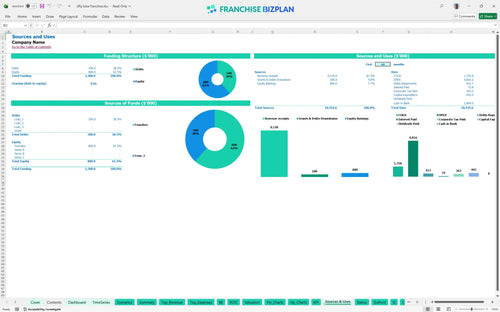
The total initial investment for this unit is approximately $495,000, which covers the franchise fee, equipment, and facility build-out. This capital expenditure is front-loaded to ensure the shop is fully equipped with service bay lifts and diagnostic tools before the March 2026 launch. You will need to manage these funds carefully to maintain the $793,000 minimum cash balance required for a safe ramp-up period.
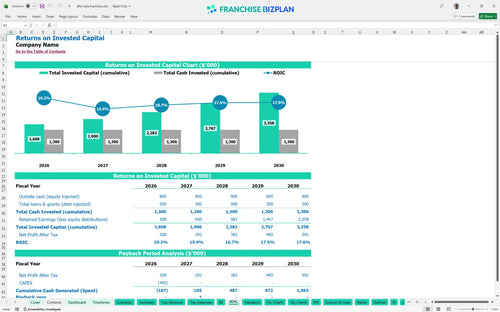
Investors can expect an internal rate of return (IRR) of 7.14% and a return on equity (ROE) of 2.57% based on current projections. The ROI analysis for new franchise unit indicates a 2-year payback period, which is quite fast for a brick-and-mortar automotive operation. Every dollar of equity is backed by a maturing revenue stream that grows from $1.45M to over $2.2M by the end of the five-year forecast.
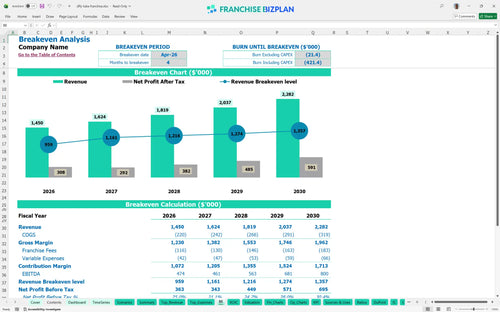
The unit hits its monthly break-even point in April 2026, just four months after the lease commences. This rapid transition to positive cash flow is driven by the high volume of oil changes and the operational cost breakdown for quick lube center activities. Maintaining parts and oil COGS at or below 11% is the most critical lever for protecting this break-even timeline during the first year.
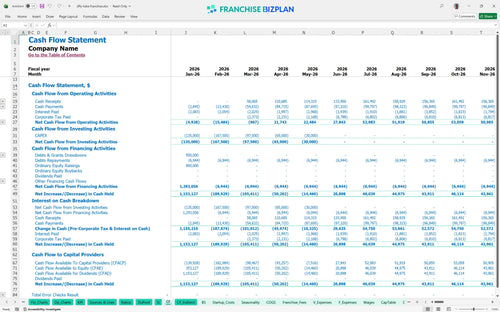
The lowest cash point occurs in May 2026 at $793,000, following the heavy equipment and build-out spending phase. You need enough runway to cover the $12,000 monthly rent and $3,500 in utilities while the customer base builds. We defintely recommend keeping a cash buffer to handle the lag in B2B fleet service payments, which can often take 30 to 60 days to collect.
Financial forecasting for automotive maintenance franchise units shows that a high-performance scenario can push Year 1 EBITDA well above $500,000 if bay utilization exceeds 85%. Conversely, a low-volume scenario significantly extends the 2-year payback period and increases the peak cash need during the ramp-up. Estimating revenue for independent automotive franchises requires this kind of sensitivity analysis to ensure the business survives a slow first quarter.
Finance: update unit break-even and payback model by Friday.
This franchise financial model is a fully editable franchise financial projection spreadsheet built in Excel, allowing you to swap out every assumption from oil change volume to hourly technician wages. It is a critical tool for any automotive franchise investment where local labor rates and rent vary significantly by zip code. By adjusting the pre-filled formulas, you can simulate how different operating expenses and staffing levels impact your bottom line before you sign a lease.

Success in the automotive sector requires looking beyond the first year, which is why this auto repair shop business plan includes detailed 5-year revenue forecasting and cash flow projection. You can track how profitability matures from a year-one EBITDA of $474,000 to over $800,000 by year five as your local reputation grows. This franchise profitability analysis helps you plan for future equipment upgrades and multi-unit expansion by showing exactly when the business generates excess cash.

Managing the ongoing costs of a brand is vital for analyzing franchise unit economics and ensuring your store-level margin stays healthy. This model specifically tracks the 4% royalty and 4% marketing fund contributions, which total 8% of your gross sales every month. By inputting the $35,000 initial franchise fee, you can see how these corporate obligations impact your total liquidity and long-term return on investment.

Knowing how to calculate startup costs for an automotive franchise is the first step to securing financing and avoiding mid-project cash crunches. This model includes a comprehensive break-even analysis that identifies the exact month your revenue covers both fixed and variable costs. With a projected 4-month path to break-even, you can plan your working capital needs with precision and understand the volume of oil changes required to stay in the black.

The model incorporates built-in industry benchmarks to help you sanity-check your labor costs and rent against typical automotive service centers. If your projected technician wages or facility maintenance costs drift too far from the norm, the model highlights these variances for review. This ensures your projections remain realistic and aligned with the actual performance of high-volume quick lube locations in the US market.


Simply purchase and download the financial model template, then access it instantly using Microsoft Excel or Google Sheets. No installation or technical expertise required-just open and start working.

Enter your business-specific numbers, including revenue projections, costs, and investment details. The pre-built formulas will automatically calculate financial insights, saving you time and effort.

Leverage the investor-ready format to confidently showcase your financial projections to banks, franchise representatives, or investors. Impress stakeholders with clear, data-driven insights and professional reports.

Leverage the investor-ready format to confidently present your projections to banks, franchise representatives, or investors.