
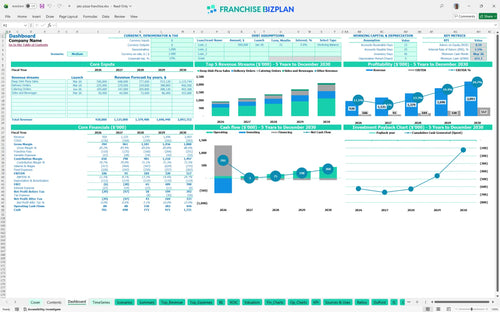
All-in-one Dashboard
Core inputs and core outputs


This pizza franchise financial model provides a complete toolkit for analyzing operating margins for pizza delivery franchises, including CAPEX schedules, payroll calculators, and 5-year P&L statements.
Core inputs and core outputs
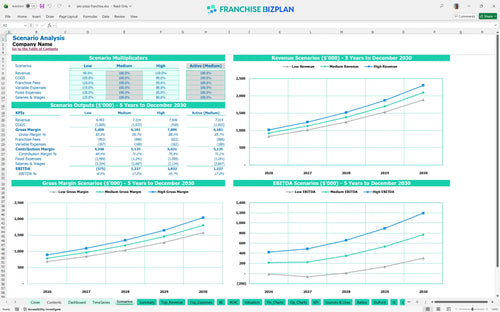
Three scenario analysis
Presentation ready
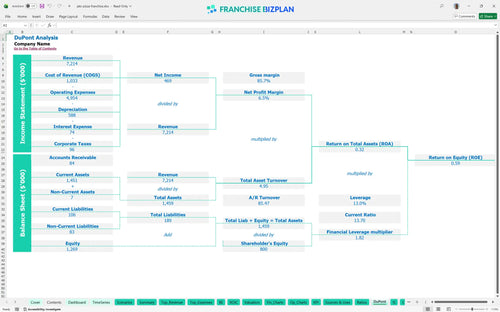
DuPont analysis
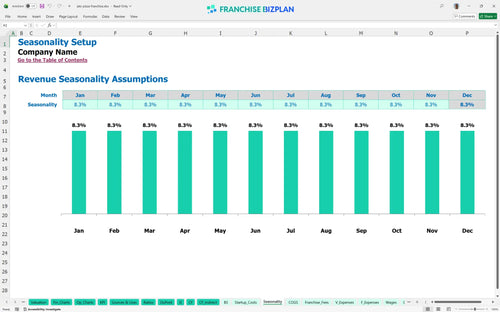
Researched revenue assumptions
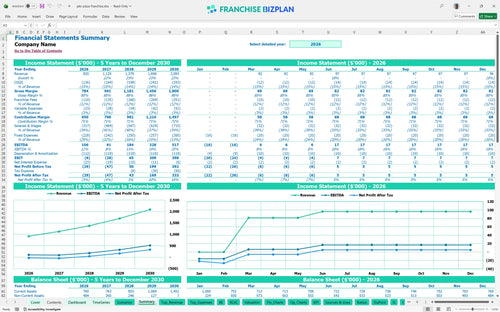
Lender-friendly financial outputs
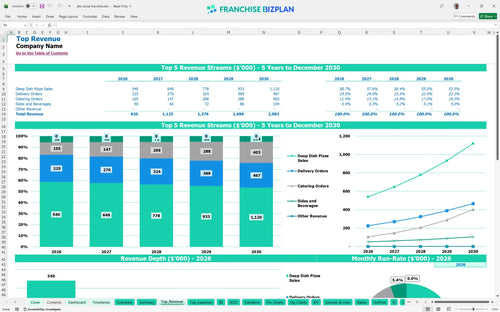
Revenue stream detailed view
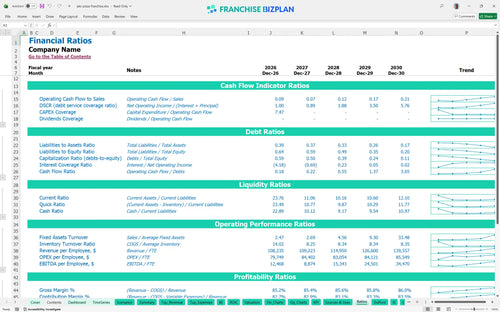
Performance metrics benchmark
We built this pizza franchise financial model using detailed research on unit-level performance and cost structures. Key assumptions like the $14,000 monthly rent and the 10% royalty fee are pre-populated but fully editable to fit your specific site. With year one revenue projected at $920,000, this model helps you visualize the path from opening day to a mature, high-volume pizza operation.
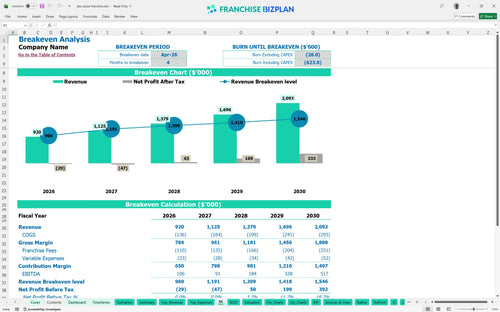
The unit reaches its monthly break-even point in April 2026, just four months after launch. While year one EBITDA starts at $106,000, true scale kicks in by year five as revenue climbs toward $2,093,000 and margins improve. Here's the quick math: you'll need to manage a 10% royalty and 1.8% packaging cost while scaling catering orders to hit these numbers.
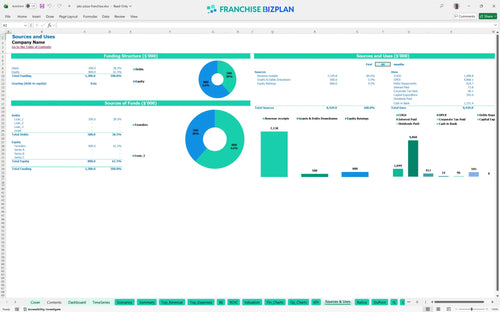
To get this unit off the ground, you are looking at a total CAPEX of $595,000 plus a significant cash buffer. The largest outlays go toward leasehold improvements at $280,000 and specialized pizza equipment totaling $95,000. You also need to account for the $30,000 franchise fee and $65,000 for delivery vehicles to maintain that signature crunch.
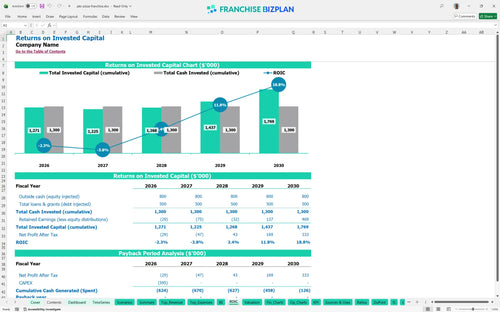
This investment shows an Internal Rate of Return (IRR) of 1.48% and a Return on Equity (ROE) of 0.59 over the initial five-year period. While the payback period extends beyond the fifth year, the enterprise value grows significantly as EBITDA reaches $517,000 in year five. What this estimate hides is the potential for faster payback if you can beat the 12% food cost benchmark.
You'll hit break-even in month 4, specifically April 2026, provided you can generate enough volume to cover the $14,000 monthly rent and $2,200 in utilities. The biggest driver for reaching this point is the deep dish pizza sales which are projected at $360,000 in the first year. If your delivery platform fees exceed the 1.5% estimate, your break-even revenue requirement will climb.
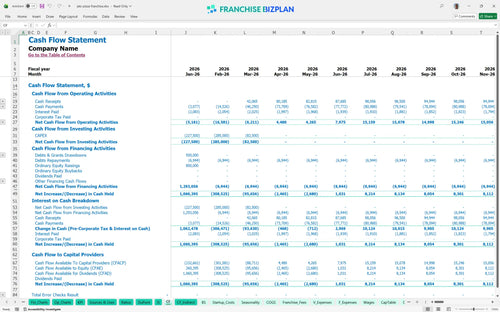
The lowest cash point occurs in May 2026, with a minimum cash requirement of $651,000 to stay liquid during the ramp-up. You need enough runway to cover the $14,000 rent and the salaries for a full team, including a $70,000 store manager, before catering revenue fully kicks in. Maintaining a cash buffer is vital because if build-out takes 60 days longer than planned, your working capital will feel the heat.
Moving from a medium to a high-growth scenario hinges on your ability to scale from $920,000 to over $2 million in annual sales. In a high-performance case, your year 5 EBITDA of $517,000 could be reached sooner if you improve food cost efficiency from 13% down to 12.2% faster than modeled. Analyzing operating margins for pizza delivery franchises shows that even a 2% swing in labor or COGS dramatically shifts your peak cash need.
Finance: update unit break-even and payback model by Friday
This pizza franchise financial model is built in Excel so you can tweak every variable as your local market shifts. You get pre-filled formulas for deep dish sales and delivery volume, but you can edit the assumptions to match your specific territory or labor market. It's a living document, not a static PDF, allowing you to stress-test your restaurant franchise business plan before signing a lease. Honestly, a model is only as good as its inputs, so we made every line item for this pizza store financial projection template easy to adjust.

Mapping out a five-year horizon is essential for understanding franchise investment feasibility and long-tail returns. This model tracks revenue scaling from $920,000 in year one to over $2 million by year five, accounting for compounding growth in catering and delivery. You'll see how EBITDA fluctuates as you add staff, with a clear view of the balance sheet and cash flow. Planning five years out helps you see past the initial chaos of opening and into the phase of true unit economics.

Running a franchise means significant off-the-top costs that eat into your store-level margin. This tool automatically calculates the 10% royalty and 2% marketing fund contributions based on your monthly sales forecasts. By baking these fees into your pizza restaurant financial forecasting, you avoid the surprise of high overhead. We also included the $30,000 initial franchise fee in the startup capital requirements for a food service franchise so your ROI analysis is defintely accurate.

You need to know exactly how much cash is required to get the doors open and how fast you can stop bleeding money. This franchise startup cost calculator totals your initial investment, including $280,000 for leasehold improvements and $95,000 for ovens. The model identifies the break-even point-expected in April 2026-where monthly revenue finally covers your fixed rent of $14,000 and variable food costs. Understanding this timeline is the most critical part of preparing a business plan for a pizza franchise location.

We've integrated real-world data to help you sanity-check your operating expenses spreadsheet against industry norms. For instance, food ingredients are modeled between 12.2% and 13%, which is a tight margin that requires disciplined kitchen management. Comparing your labor costs for cooks and drivers against these benchmarks ensures your estimating profitability for a fast-casual pizza unit stays realistic. It's about making sure your projections aren't just wishful thinking but are grounded in pizza franchise financial model standards.


Simply purchase and download the financial model template, then access it instantly using Microsoft Excel or Google Sheets. No installation or technical expertise required-just open and start working.

Enter your business-specific numbers, including revenue projections, costs, and investment details. The pre-built formulas will automatically calculate financial insights, saving you time and effort.

Leverage the investor-ready format to confidently showcase your financial projections to banks, franchise representatives, or investors. Impress stakeholders with clear, data-driven insights and professional reports.

Leverage the investor-ready format to confidently present your projections to banks, franchise representatives, or investors.