
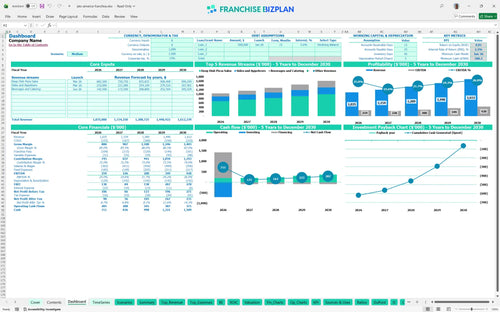
All-in-one Dashboard
Core inputs and core outputs


This Excel template for restaurant franchise financial forecasting includes a full P&L and how to build a cash flow statement for a franchise location to ensure you are ready for day-one operations.
Core inputs and core outputs
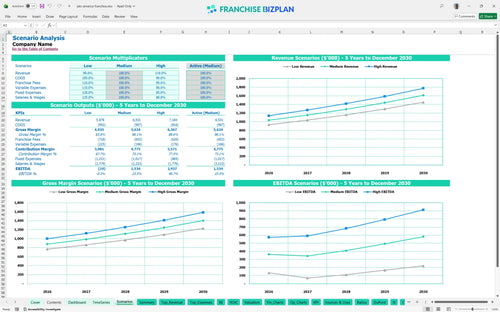
Three scenario analysis
Presentation ready
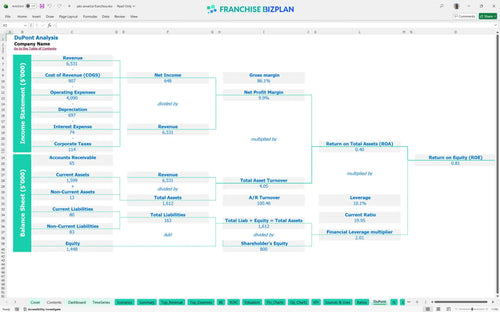
DuPont analysis
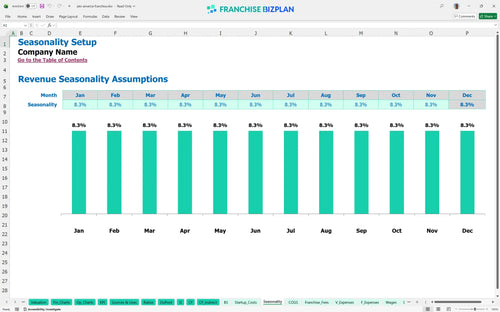
Researched revenue assumptions
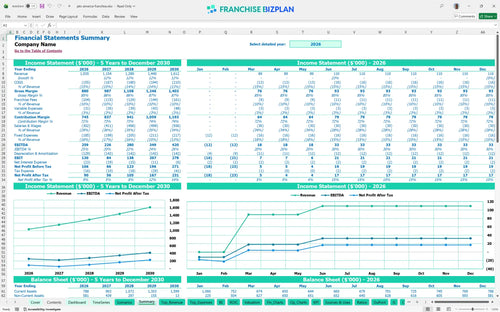
Lender-friendly financial outputs
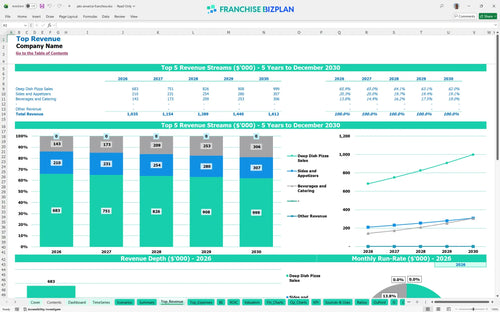
Revenue stream detailed view
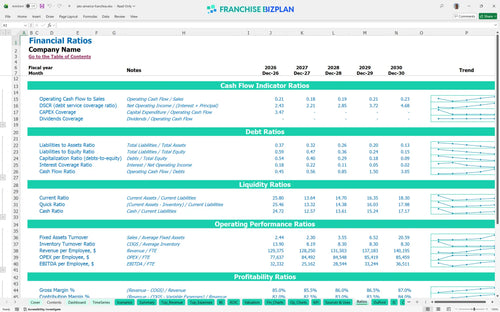
Performance metrics benchmark
We built this franchise unit profit and loss template using our own research into Detroit-style pizza operations. Key assumptions like the $30,000 franchise fee and $1,035,000 year-one revenue are pre-populated with researched data specific to Jet's America Franchise franchise unit and are fully editable. This model ensures your projections for royalties and marketing funds are grounded in reality.
How to calculate profitability for a pizza franchise depends on tracking the shift from 13.5% food costs down to 11.5% as you scale. The model shows EBITDA growing from $259,000 to $420,000 over five years, assuming you maintain signature quality and throughput.
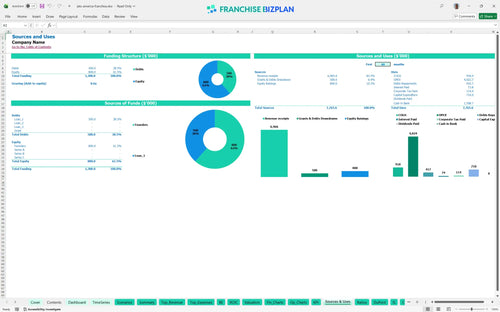
A startup cost breakdown for food service franchise shows you need $710,000 to launch, with $320,000 dedicated to leasehold improvements. This restaurant capital expenditure planning includes $110,000 for ovens and $75,000 for branded delivery vehicles to ensure the hot-to-door promise.
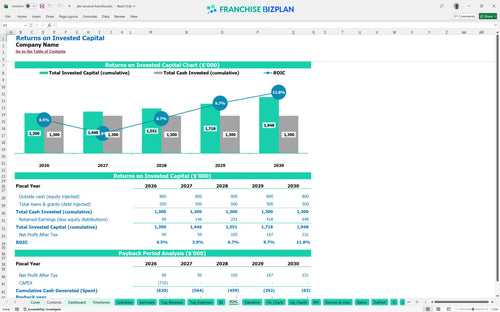
Predicting return on investment for a new franchise unit shows an IRR of 2.15% and a Return on Equity of 0.81. While the payback period extends beyond five years, the steady growth in EBITDA suggests a valuable long-term asset as revenue hits $1.6M.
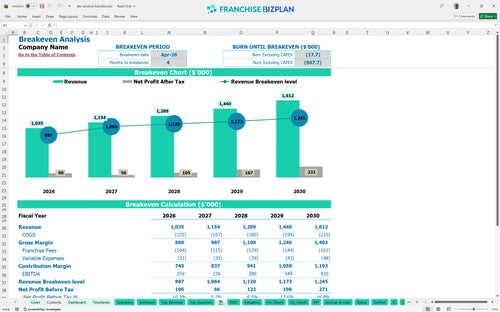
Your franchise break-even analysis points to April 2026 as the turning point for the unit, just four months after opening. The $10,000 monthly rent is your largest fixed hurdle, but the high average ticket from deep-dish sales carries the fixed costs easily.
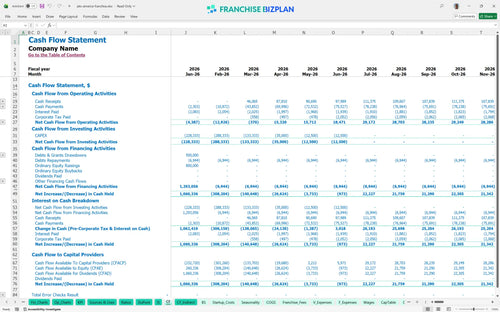
The lowest cash point occurs in June 2026 with a $580,000 balance, providing a safe runway during the initial ramp-up. Even with $15,000 in monthly fixed costs, this buffer ensures you can handle the timing gaps between opening and mature performance.
Analyzing labor and food costs in a franchise financial model across scenarios reveals how a 10% revenue swing impacts your year-one $259k EBITDA. This franchise unit performance benchmarking template helps you identify the levers needed to hit the high-case scenario and maximize your store-level margin.
This franchise financial model template is defintely built for flexibility in Excel. You can swap out pre-filled formulas and edit assumptions to match your specific territory, whether you are looking at a high-traffic urban spot or a suburban delivery hub. It makes testing different operating scenarios simple without needing a degree in finance.

Mapping out a pizza franchise business plan with detailed restaurant franchise financial projections helps you see past the initial opening chaos. We have included a financial model for multi-unit franchise expansion so you can track how margins evolve as the store matures. It is the best way to visualize your path from a single unit to a multi-unit empire.

Estimating recurring royalty and marketing fees in Excel is critical because they eat into your bottom line every month. This model captures the 8% royalty and 2% marketing fund franchise royalty fees right off the top, so you know exactly what is left for your local overhead. It keeps your eyes on the real economics of the brand standards.

Use our food franchise startup cost calculator to get a handle on the $710,000 in total capital expenditures required before you sell your first pizza. We break down leasehold improvements, equipment, and the initial fee so you can run a proper franchise break-even analysis. Knowing your number helps you manage the early-stage burn.

We have baked in best practices for pizza franchise unit economics to help you sanity-check your numbers against a real-world operating expense budget. If your food ingredients are hitting 13.5% or your labor costs look off, the unit economics analysis flags it against typical franchise performance. It is like having a CFO looking over your shoulder.


Simply purchase and download the financial model template, then access it instantly using Microsoft Excel or Google Sheets. No installation or technical expertise required-just open and start working.

Enter your business-specific numbers, including revenue projections, costs, and investment details. The pre-built formulas will automatically calculate financial insights, saving you time and effort.

Leverage the investor-ready format to confidently showcase your financial projections to banks, franchise representatives, or investors. Impress stakeholders with clear, data-driven insights and professional reports.

Leverage the investor-ready format to confidently present your projections to banks, franchise representatives, or investors.