
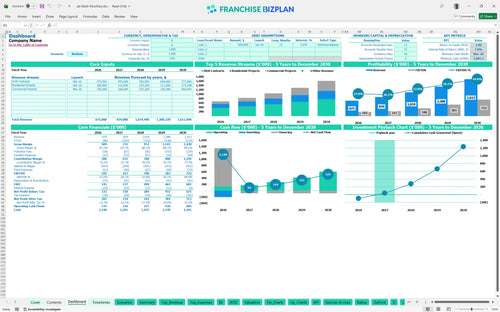
All-in-one Dashboard
Core inputs and core outputs


This comprehensive Excel template for franchise unit cash flow projections includes pre-researched revenue streams, tiered staffing plans, and detailed CAPEX schedules for a turn-key financial planning experience.
Core inputs and core outputs
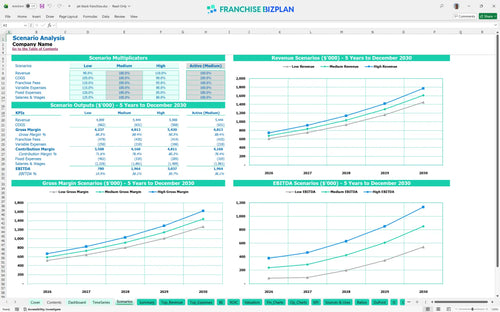
Three scenario analysis
Presentation ready
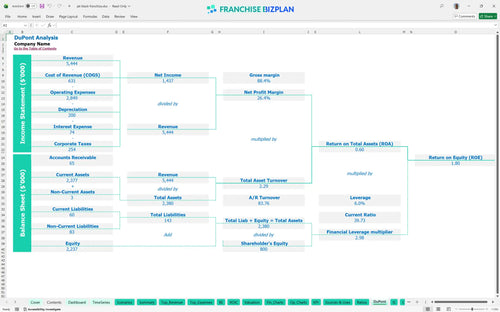
DuPont analysis
Researched revenue assumptions
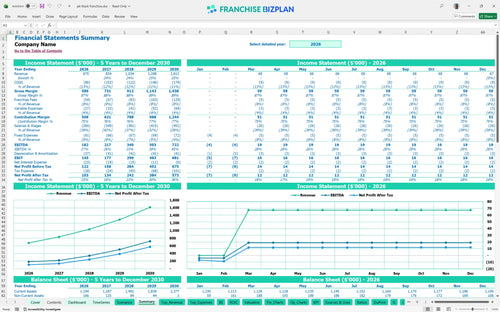
Lender-friendly financial outputs
Revenue stream detailed view
Performance metrics benchmark
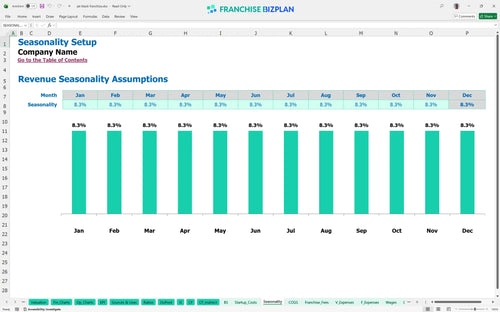
We built this Jet-Black Franchise franchise unit financial model using intensive research into the pavement preservation industry and service-based franchise structures. Key assumptions like the $675,000 year-one revenue target and the 8% royalty fee are pre-populated and fully editable to match your local Charlotte or Ballantyne market conditions. Honestly, having a model that already knows your sealcoating material costs run about 11% of sales saves you dozens of hours in the planning phase.
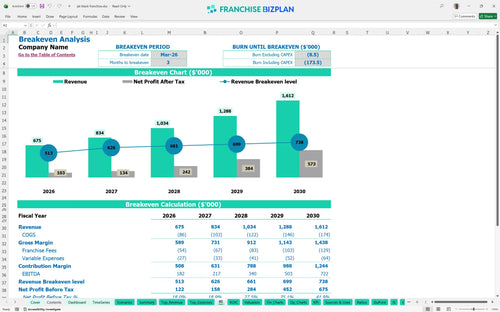
The franchise unit is projected to reach profitability very quickly, achieving break-even by March 2026, just three months after launching. With a Year 1 EBITDA of $182,000 and a Year 5 target of $722,000, the profitability analysis for home service franchise locations shows a strong upward trajectory as you secure more HOA contracts. Still, you need to keep a close eye on your 11% material costs to protect those margins.
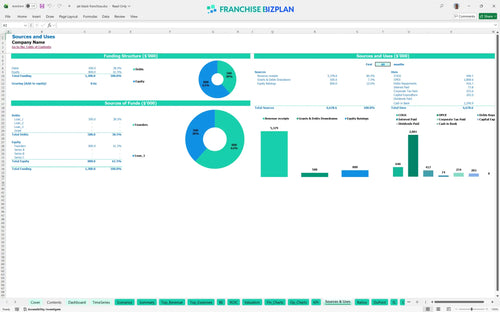
To launch this unit in the US, you will need approximately $203,000 in total initial investment, which covers your franchise fee and all essential equipment. This capital is allocated across heavy assets like the $45,000 branded truck and $60,000 in sealcoating machinery to ensure you meet brand standards from day one. Here is the quick math: your initial cash outlay is heavily weighted toward equipment that drives your daily throughput.
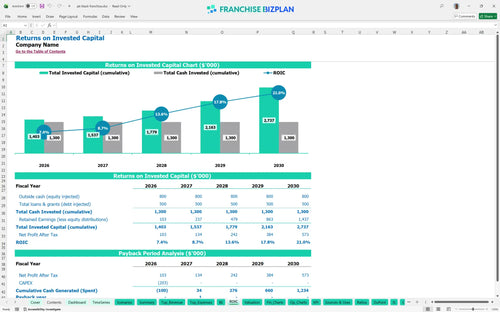
Investors can expect a 7.8% Internal Rate of Return (IRR) and a Return on Equity (ROE) of 1.8 based on the current 5-year forecast. The payback period is remarkably short at just 2 years, which is excellent for a service business with significant upfront equipment costs. What this estimate hides is the potential for higher returns if you can scale your commercial project volume faster than the baseline 10% growth.
The unit hits its monthly break-even point in March 2026, requiring enough volume to cover $4,700 in monthly fixed costs like rent and insurance plus the 8% royalty burden. The primary driver for hitting this goal is securing the initial $250,000 in HOA contracts scheduled for the first year. If you miss your early spring sales targets, the break-even date will defintely slide into the summer months.
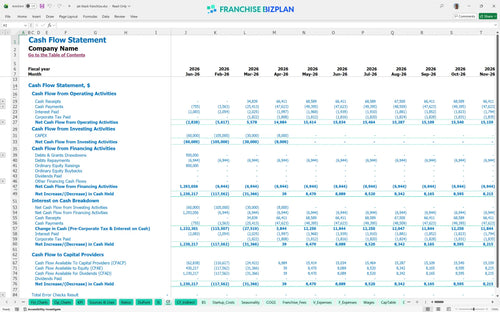
The lowest cash point occurs in March 2026 with a minimum balance of $1,081, which means your liquidity is tightest right as you start operations. You need to ensure your initial working capital covers the $13,916 monthly payroll for your manager and technicians before the first big contract checks clear. Plus, keeping a small cash buffer is recommended to handle any unexpected equipment maintenance in the first quarter.
In a high-growth scenario where commercial projects exceed the $80,000 year-one estimate, your Year 5 revenue could climb well past $1.6 million, significantly boosting your 1.8 ROE. Conversely, a low-growth case where HOA contracts lag would delay your 2-year payback and increase the pressure on your $2,500 monthly yard rent. Best practices for franchise unit financial planning suggest stress-testing the model by increasing fuel costs by 20% to see the impact on net margin.
Finance: update unit break-even and payback model by Friday.
This franchise financial model is fully customizable in Excel, featuring pre-filled formulas and editable assumptions that let you adapt the numbers to your specific territory and operating scenario. You can adjust the asphalt service mix or local labor rates to see how store-level margins shift in real-time. It is a flexible franchise financial model designed to handle the nuances of a service-based business without the headache of building a spreadsheet from scratch.

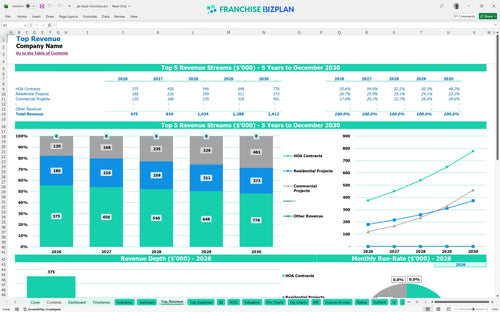
Planning for a single territory or a multi-unit expansion requires a clear view of the future, which is why this tool provides detailed 5-year revenue and cash flow projections. You can track how revenue grows from $675,000 in year one to over $1.6 million by year five while monitoring your capital expenditure budget for fleet additions. This franchise financial projection spreadsheet ensures you are defintely prepared for the scaling phase of your business.

The model accurately captures your ongoing franchise royalty fees and initial costs, ensuring you understand exactly how much goes back to the franchisor. With a fixed 8% royalty and a $48,000 initial fee, the math is straightforward but vital for protecting your store-level EBITDA. We have baked these franchise-specific obligations into the cash flow so you can see the impact of the recurring revenue model on your bottom line.

Estimating your total initial investment is the first step to a successful launch, covering everything from the branded service truck to pressure washers. This franchise startup costs template helps you visualize the $203,000 in initial capital needs and identifies the exact month you will hit break-even. Understanding your fixed and variable cost structure is essential for anyone learning how to build a budget for a sealcoating franchise unit.

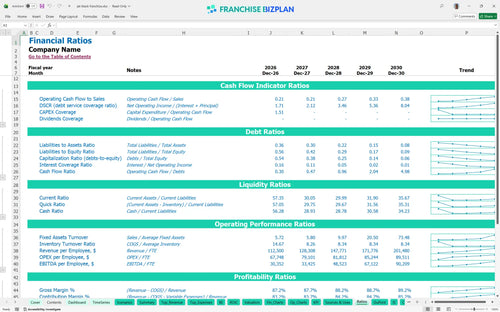
We have integrated franchise unit economics and industry benchmarks to help you sanity-check your operating expense forecast against real-world standards. Whether you are looking at labor costs for your crew technicians or material spend for sealcoating, the model provides a baseline for comparison. This financial benchmarking for local service franchises ensures your projections stay grounded in reality rather than best-case scenarios.


Simply purchase and download the financial model template, then access it instantly using Microsoft Excel or Google Sheets. No installation or technical expertise required-just open and start working.

Enter your business-specific numbers, including revenue projections, costs, and investment details. The pre-built formulas will automatically calculate financial insights, saving you time and effort.

Leverage the investor-ready format to confidently showcase your financial projections to banks, franchise representatives, or investors. Impress stakeholders with clear, data-driven insights and professional reports.

Leverage the investor-ready format to confidently present your projections to banks, franchise representatives, or investors.