
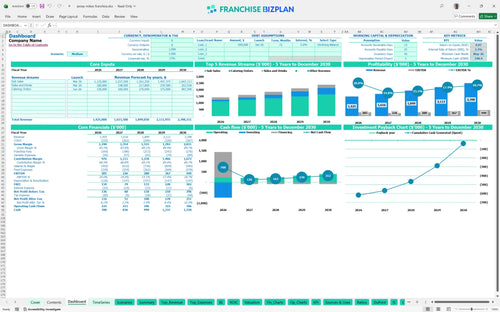
All-in-one Dashboard
Core inputs and core outputs


This Excel template for restaurant franchise financial projections includes a full suite of P&L statements, cash flow trackers, and CAPEX schedules to manage your sandwich shop investment.
Core inputs and core outputs
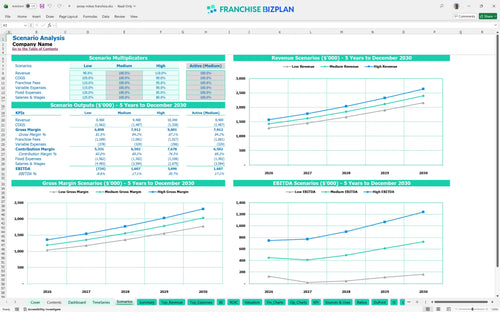
Three scenario analysis
Presentation ready
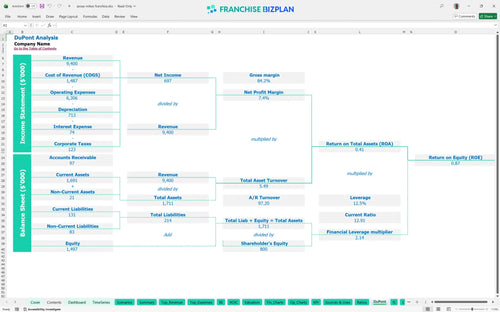
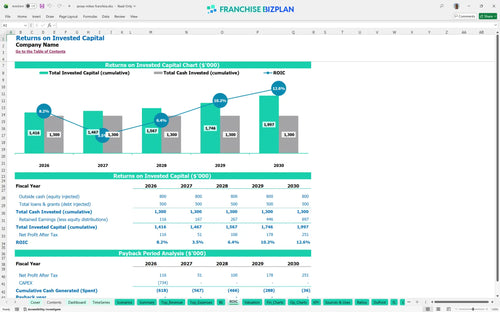
DuPont analysis
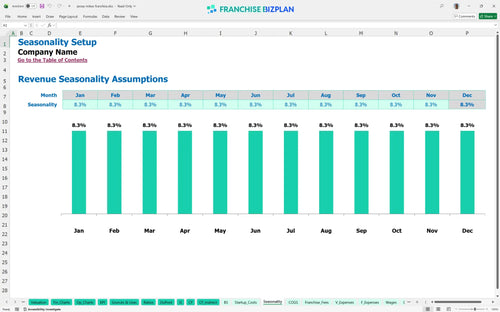
Researched revenue assumptions
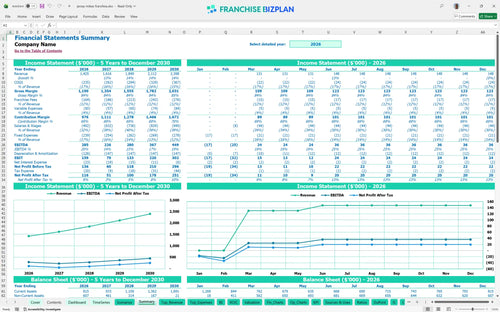
Lender-friendly financial outputs
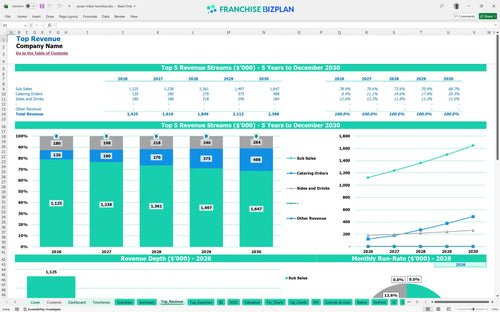
Revenue stream detailed view
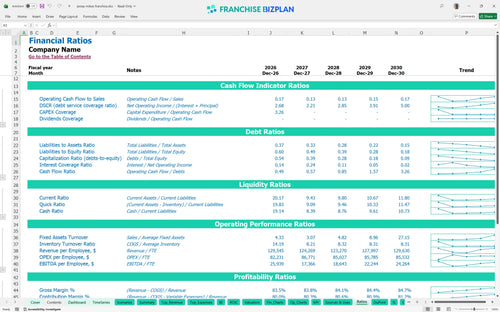
Performance metrics benchmark
We built this franchise unit financial model using our own research into high-growth sandwich operations. Key assumptions, including analyzing franchise unit revenue streams starting at $1.42M and the 6.5% royalty structure, are pre-populated and fully editable to reflect your local market conditions.
The unit hits a positive EBITDA of $285,000 in its first year, but true net profitability depends on managing the $14,000 monthly rent and high-energy labor. With food costs starting at 14.5%, you need consistent daily traffic to clear your fixed overhead and royalties.
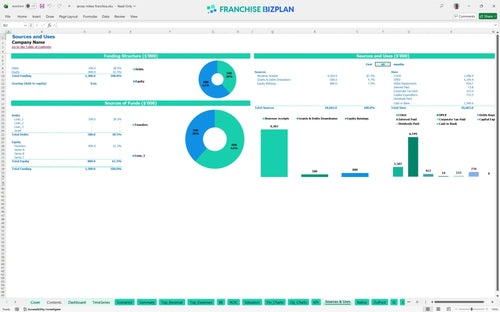
You will need over $730,000 in initial capital before accounting for your opening cash buffer. The primary drain on funds is capital expenditure planning for the $400,000 build-out and $180,000 in specialized kitchen equipment like meat slicers and refrigeration units.
This is a long-term equity play, as the high initial investment leads to a payback period that extends after Year 5. While the Year 5 EBITDA reaches a healthy $449,000, the 2.26% IRR and 0.87 ROE mean you must focus on multi-unit scaling to maximize your franchise ROI.
The unit reaches its monthly break-even point in April 2026, just four months after the doors open. This rapid ramp-up is possible because of the strong brand equity, but it requires hitting your targets for sub sales and catering immediately to cover the $14,000 rent.
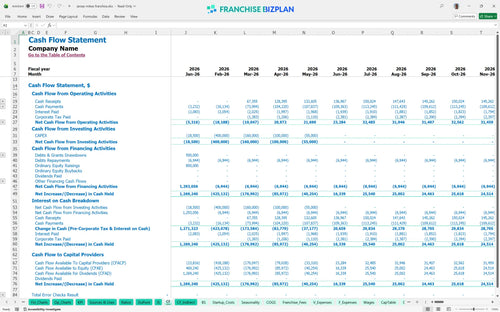
Your lowest cash balance occurs in May 2026, where the model shows a minimum cash position of $541,000. This assumes a smooth opening; any delays in construction or permitting will increase the pressure on your startup budget template for fast casual restaurant operations.
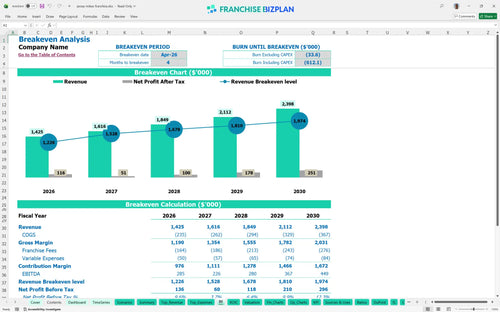
A 10% shift in volume significantly impacts your Year 1 EBITDA of $285,000 and can delay your break-even by several months. Using this sandwich shop franchise financial model to test a High Case scenario shows how maximizing the mobile app and catering can accelerate your payback timing.
This franchise unit profit and loss statement template provides the precise operating expense forecast needed for a professional bank package. It stands as one of the best financial planning tools for new franchisees to stress-test their assumptions and manage their QSR franchise operating budget spreadsheet effectively.
Finance: update unit break-even and payback model by Friday
This franchise financial model is built in Excel, giving you total control over every variable. You can easily adjust the pre-filled formulas and editable assumptions to match your specific territory, whether you are changing sandwich prices or tweaking the staffing mix. It serves as a flexible franchise startup cost template that adapts to your unique operating scenario.

Long-term planning is essential for a high-volume sandwich shop. This model provides a detailed restaurant franchise business plan with 5-year projections for revenue, costs, and cash flow. You can see how the initial $1.42M in Year 1 sales scales to $2.39M by Year 5, allowing for a deep franchise profitability analysis over the life of the investment.

This tool specifically captures the financial obligations unique to the brand, including the 6.5% royalty and 5% marketing fund contribution. By estimating franchise royalty and marketing fees accurately, you can see the real impact on your store-level margins. It ensures that these off-the-top costs are accounted for before you calculate your take-home pay.

Launching a new unit requires significant upfront capital, particularly with leasehold improvements reaching $400,000. This franchise investment calculator helps you map out the total initial investment and perform a detailed break-even analysis. You will know exactly what sales volume is required to cover your $14,000 monthly rent and variable labor costs.

We have included built-in unit economics benchmarks to help you sanity-check your operating assumptions. By comparing your food costs-which start at 14.5%-and labor metrics against industry standards, you can defintely identify potential margin leaks early. This makes it a powerful financial feasibility study for franchise unit operators who need to verify their budget.


Simply purchase and download the financial model template, then access it instantly using Microsoft Excel or Google Sheets. No installation or technical expertise required-just open and start working.

Enter your business-specific numbers, including revenue projections, costs, and investment details. The pre-built formulas will automatically calculate financial insights, saving you time and effort.

Leverage the investor-ready format to confidently showcase your financial projections to banks, franchise representatives, or investors. Impress stakeholders with clear, data-driven insights and professional reports.

Leverage the investor-ready format to confidently present your projections to banks, franchise representatives, or investors.