
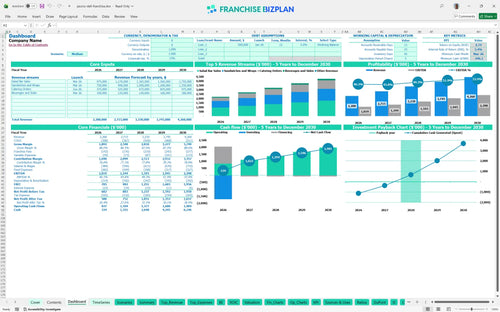
All-in-one Dashboard
Core inputs and core outputs


This restaurant business plan Excel tool includes a comprehensive dashboard, detailed revenue builds for catering and dine-in, and a full set of pro-forma financial statements to guide your investment decision.
Core inputs and core outputs
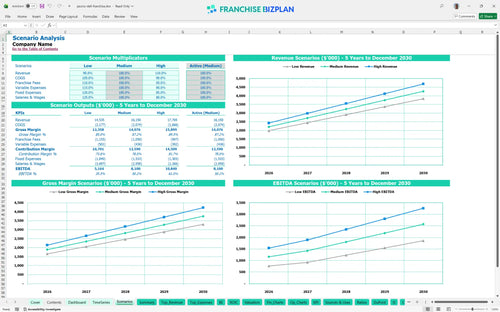
Three scenario analysis
Presentation ready
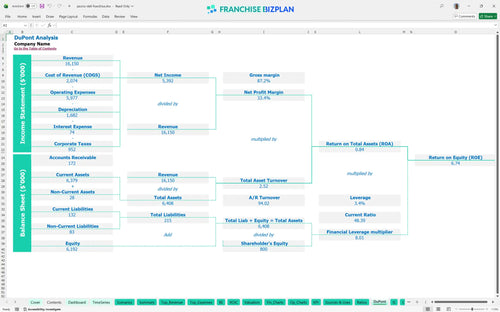
DuPont analysis
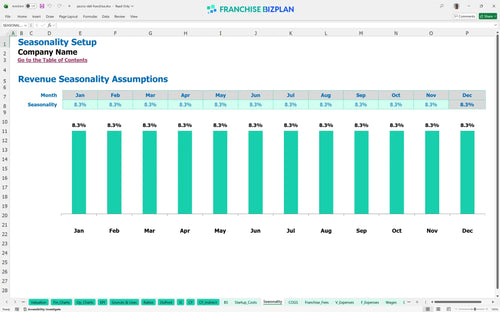
Researched revenue assumptions
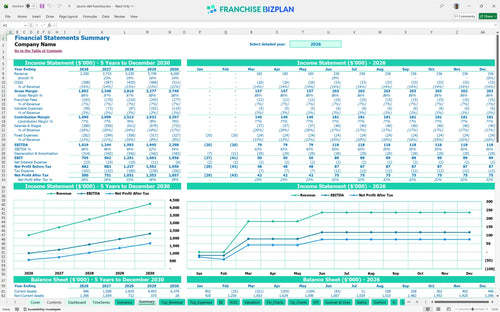
Lender-friendly financial outputs
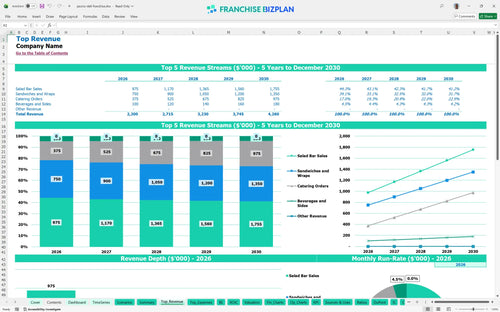
Revenue stream detailed view
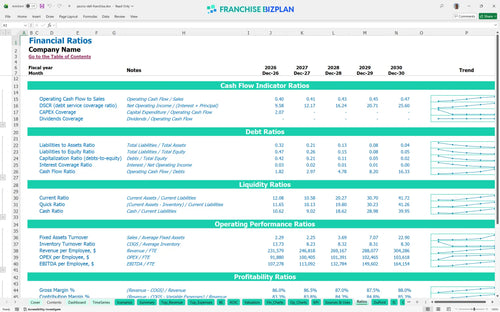
Performance metrics benchmark
We built this franchise unit financial model using our own research on the unit economics of high-volume deli concepts. The assumptions for estimating labor and food costs for sandwich shop franchises are pre-populated with data showing a $2.2M Year 1 revenue target and a 3-year payback period. Honestly, these numbers are fully editable, so you can adjust the $1.71M total investment to match your specific Nashville or urban market build-out costs.
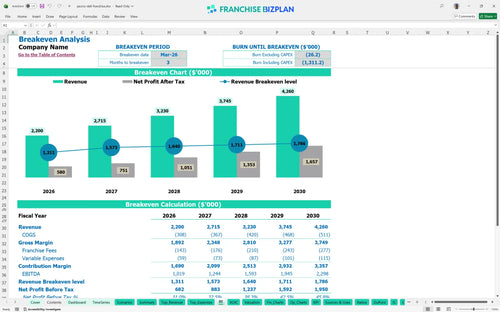
The unit reaches proftability in March 2026, just three months after opening. This rapid transition happens because the model projects $2.2M in first-year sales, which covers the 5% royalty and $18,000 monthly rent quickly. Proftability starts in month three if you hit the $2.2M target.
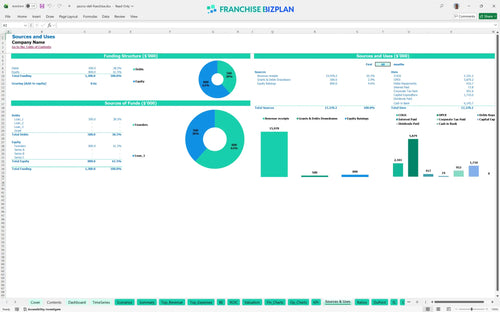
You need approximately $1.71M to launch this unit. This covers the $35,000 franchise fee, $800,000 in leasehold improvements, and $450,000 for specialized kitchen and salad bar equipment. Your build-out is the biggest check you will sign.
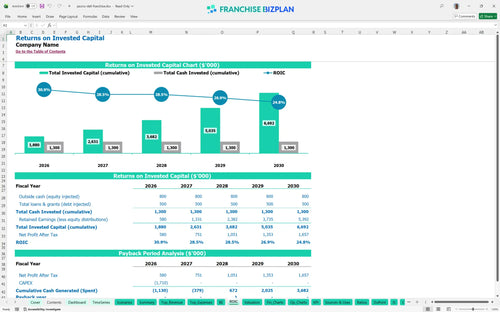
Investors can expect a 5.38% Internal Rate of Return (IRR) and a 6.74% Return on Equity. With a 3-year payback period, the unit generates $2.29M in EBITDA by Year 5. A three-year payback is a solid win in fast-casual.
The monthly break-even point is reached in March 2026. The primary driver is the $18,000 rent and the high labor cost for a dual-service model. Volume is the only way to outrun an $18,000 rent bill.
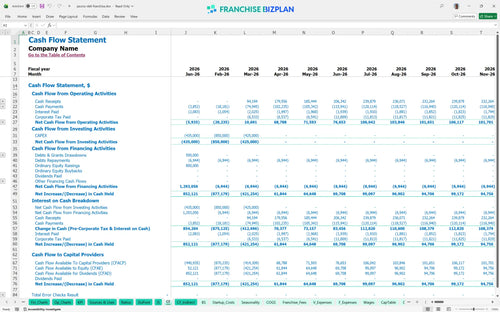
The lowest cash point is -$446,000 in March 2026 during the initial ramp-up. You defintely need a working capital buffer to handle the gap between build-out and peak catering revenue. Cash is king, but the buffer is your insurance policy.
In the High scenario, Year 5 revenue hits $4.26M, significantly boosting your store-level margin. Analyzing catering revenue in restaurant financial models shows it is the key to moving from a Low to a High case. Execution in the high case doubles your Year 5 EBITDA.
This franchise financial model template is built in Excel to give you total control over your deli shop projections. You can adjust every variable, from the cost of sourdough to the hourly rate of your frontline crew, without breaking the underlying logic. It is a plug-and-play tool for complex deli math. The pre-filled formulas handle the heavy lifting, allowing you to focus on site-specific assumptions like local rent and regional labor trends. Whether you are opening one unit in Nashville or planning a multi-unit expansion, this Excel template for restaurant franchise financial projections adapts to your specific footprint and market density.

Long-term planning is the difference between a struggling shop and a thriving chain. This model provides a detailed 5-year outlook, mapping your growth from a $2.2M opening year to a mature $4.26M operation. It tracks how food service profitability analysis changes as your catering revenue scales and your food waste decreases over time. Five years of data turns a guess into a strategy. You will see exactly how store-level EBITDA evolves as you move through the ramp-up phase and into steady-state performance, helping you communicate clearly with lenders and partners about the future of your small business financial forecasting for food franchises.

Operating a franchise means managing specific financial obligations that independent shops do not face. This model factors in the 5% royalty and 1.5% marketing fund contributions right off the top, ensuring your franchise unit profit and loss statement template reflects the true net cash available. Royalties are a fixed reality, not a variable surprise. By automating these calculations based on your gross sales, the model helps you understand how these fees impact your daily margins and overall franchise investment projection. It is essential for seeing how brand-level costs interact with local operating expenses like utilities and repairs.

Launching a new location requires a clear view of your capital expenditure budget. This franchise startup cost calculator breaks down everything from the $35,000 initial fee to the $800,000 leasehold improvements. Knowing your zero-profit number is the first step to real gains. We help you determine the exact volume of sandwiches and salad bar trips needed to cover your $18,000 monthly rent and other fixed costs. This section is vital for how to calculate startup costs for a deli franchise, providing a clear roadmap from the first dollar spent to the moment the unit begins paying you back.

Don't fly blind when estimating your food and labor costs. This model includes built-in benchmarks to help with best practices for restaurant franchise budget planning. If your food ingredients are projected at 12% but the industry average is higher, the model helps you identify that gap. Benchmarks keep your projections grounded in the real world. You can sanity-check your $18,000 prime location rent against your $2.2M revenue target to ensure your occupancy costs stay within a healthy range. This data-driven approach ensures your financial planning for multi-unit food service franchises is realistic and defensible.


Simply purchase and download the financial model template, then access it instantly using Microsoft Excel or Google Sheets. No installation or technical expertise required-just open and start working.

Enter your business-specific numbers, including revenue projections, costs, and investment details. The pre-built formulas will automatically calculate financial insights, saving you time and effort.

Leverage the investor-ready format to confidently showcase your financial projections to banks, franchise representatives, or investors. Impress stakeholders with clear, data-driven insights and professional reports.

Leverage the investor-ready format to confidently present your projections to banks, franchise representatives, or investors.