
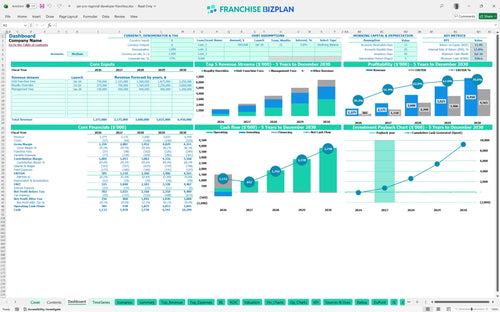
All-in-one Dashboard
Core inputs and core outputs


This comprehensive package includes a master franchise unit franchisee recruitment model, detailed CAPEX schedules, and a full 5-year P&L designed specifically for regional developers.
Core inputs and core outputs
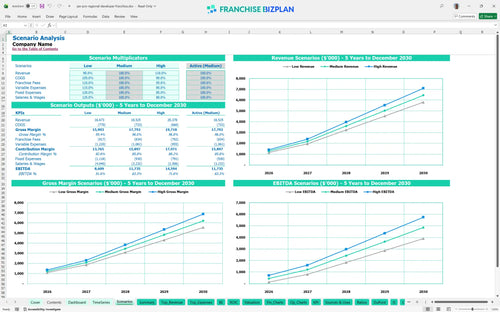
Three scenario analysis
Presentation ready
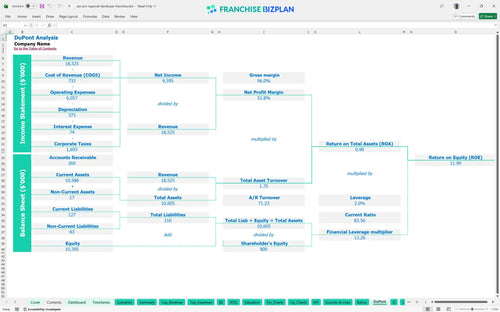
DuPont analysis
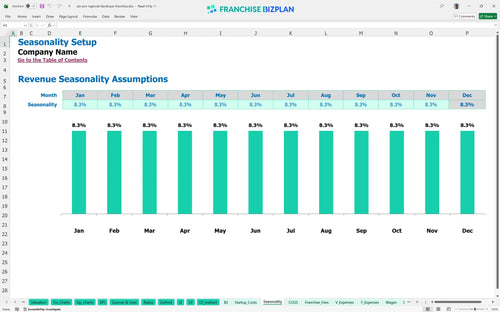
Researched revenue assumptions
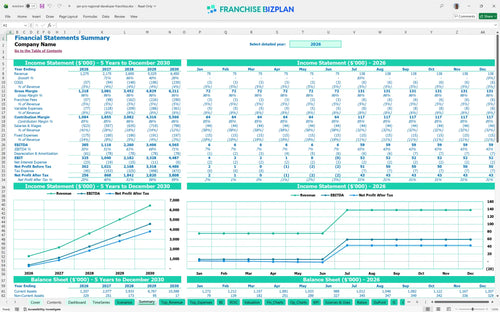
Lender-friendly financial outputs
Revenue stream detailed view
Performance metrics benchmark
We built this regional developer financial model using extensive research into the commercial cleaning sector and master license structures. Key assumptions, including $500,000 in Year 1 unit franchise fees and a $120,000 Regional Director salary, are pre-populated and fully editable to match your Austin or similar high-growth territory. This model provides the data-driven clarity needed to move from a prospect to a confident operator.
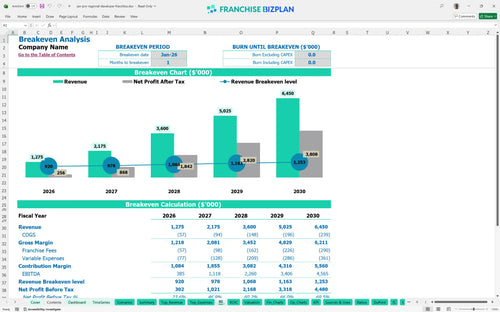
Based on the researched data, this regional unit becomes profitable almost immediately, hitting its break-even date in January 2026. By Year 3, EBITDA (earnings before interest, taxes, depreciation, and amortization) is projected to reach $2.26M as royalty overrides begin to outpace fixed office costs. Profitability relies on your ability to maintain a 1-month break-even speed through aggressive initial unit sales.
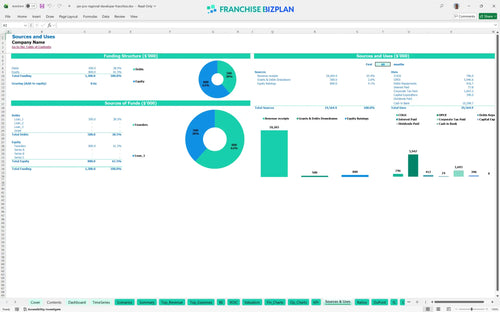
You will need a significant war chest to fund the master license territory expansion, with a minimum cash requirement of $937,000. The total initial investment covers the $50,000 regional fee, $120,000 for office improvements, and $60,000 for lead generation software development. This capital ensures you can carry the $453,000 annual payroll for your executive team during the ramp-up phase.
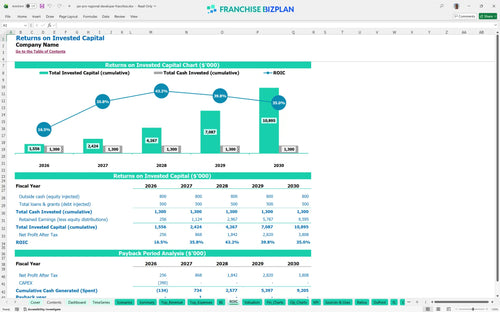
The model shows an Internal Rate of Return (IRR) of 13.82% and a Return on Equity (ROE) of 11.99%. With a payback period of only 2 years, the business model template for cleaning franchise developers demonstrates strong capital efficiency for an executive-level play. Your Year 5 EBITDA is projected to hit $4.56M, providing a massive exit multiple if you choose to sell the territory.
The unit reaches break-even in its first month, January 2026, because of the high upfront unit franchise fees of $500,000 projected for the first year. The biggest driver for maintaining this is the consistent recruitment of new owner-operators to offset the $8,000 monthly office rent and $120,000 Regional Director salary. If recruitment slows, your fixed cost burden will quickly eat into your cash reserves.
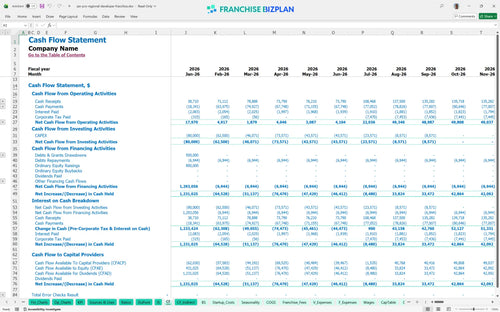
Your cash trough occurs in July 2026 at $937,000, so you defintely need to ensure your initial funding covers this ramp-up period. This low point happens as you finalize the $60,000 lead gen software and $30,000 training facility setup while payroll for six full-time employees scales up. Having an additional cash buffer is recommended to handle any delays in B2B contract signings or unit franchisee onboarding.
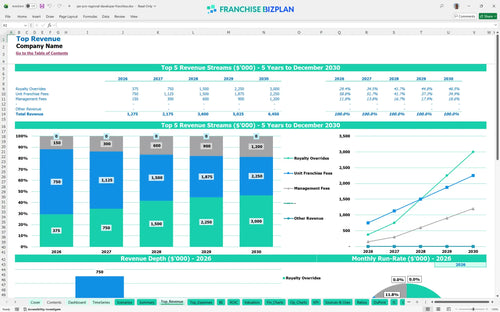
If your unit franchisee recruitment strategy slows by 20% in a low-case scenario, your Year 1 revenue of $1.27M could drop, pushing back your 2-year payback. Conversely, hitting the high case depends on maximizing the $800,000 in management fees and $2,000,000 in royalty overrides projected for Year 5. The difference between scenarios often comes down to your local marketing execution and lead conversion rates.
This Excel-based master franchise financial model allows you to adjust every variable for your regional territory, from unit recruitment targets to local office overhead. Since it uses open formulas, you can easily adapt the master franchise investment analysis to match your specific market density and growth speed. Here is the quick math: how to build a financial model for a master franchise depends on your ability to toggle unit sales and royalty overrides in real-time. One wrong assumption in your recruitment ramp-up can shift your capital needs by six figures.

Plan your expansion with a multi-year view that tracks revenue scaling from $1.27M in Year 1 to over $6.4M by Year 5. This commercial cleaning regional developer financial forecast maps out the transition from initial recruitment fees to steady-state royalty overrides. These franchise operational projections help you visualize the long-term equity you are building in the territory. What this estimate hides is the intense operational pressure of supporting fifty units versus five.

Track the complex flow of funds between your unit owners and the corporate office, including the 4% royalty and 0.5% marketing fund. The model simplifies managing royalty overrides in a franchise model so you see exactly what stays in your pocket after the brand takes its cut. At $6.45M in Year 5 revenue, those small percentage points become the lifeblood of your regional office. Every basis point of margin leak matters when you are the middleman.

Launching a regional hub requires significant upfront capital, including $120,000 for leasehold improvements and a $50,000 regional fee. This tool calculates your startup costs for a regional janitorial master franchise, showing you exactly how many unit franchises you need to sell to cover your $8,000 monthly office rent. If your build-out takes 90 days longer than planned, your working capital pressure will rise fast. Precision in your initial CAPEX (capital expenditure) prevents mid-year cash crunches.

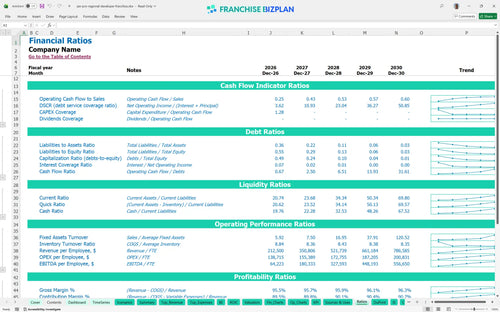
We have baked in industry-standard margins to help you sanity-check your projections against real-world performance. Use this commercial cleaning franchise P&L model to see if your 4% sales commission or 3% training material costs align with typical regional developer standards. Comparing your expected performance against these benchmarks ensures your business plan is grounded in reality. High margins are great, but only if they are sustainable as you scale.


Simply purchase and download the financial model template, then access it instantly using Microsoft Excel or Google Sheets. No installation or technical expertise required-just open and start working.

Enter your business-specific numbers, including revenue projections, costs, and investment details. The pre-built formulas will automatically calculate financial insights, saving you time and effort.

Leverage the investor-ready format to confidently showcase your financial projections to banks, franchise representatives, or investors. Impress stakeholders with clear, data-driven insights and professional reports.

Leverage the investor-ready format to confidently present your projections to banks, franchise representatives, or investors.