
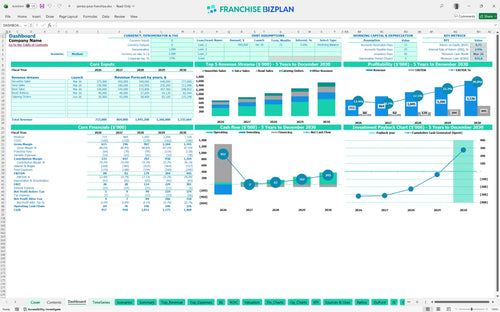
All-in-one Dashboard
Core inputs and core outputs


This comprehensive Excel tool provides a 5-year roadmap covering startup costs, daily operations, and long-term ROI for a high-volume retail unit.
Core inputs and core outputs
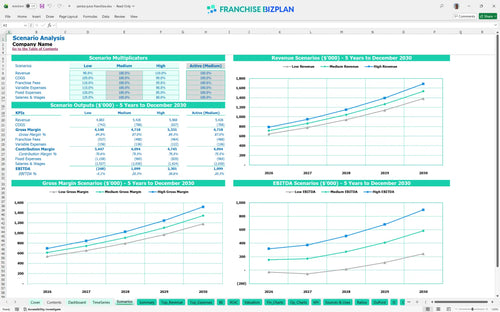
Three scenario analysis
Presentation ready
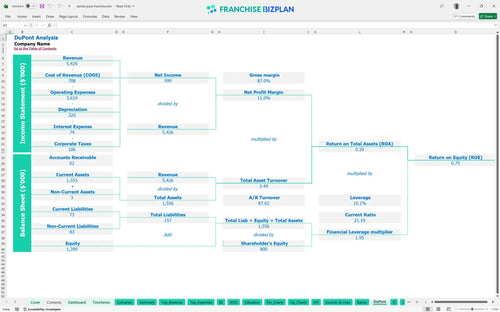
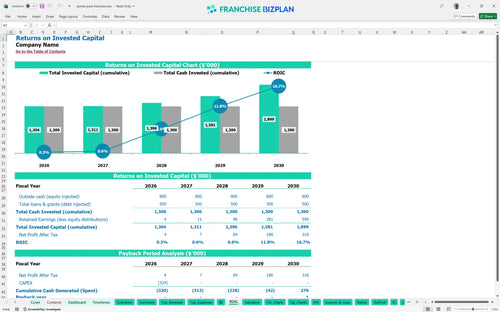
DuPont analysis
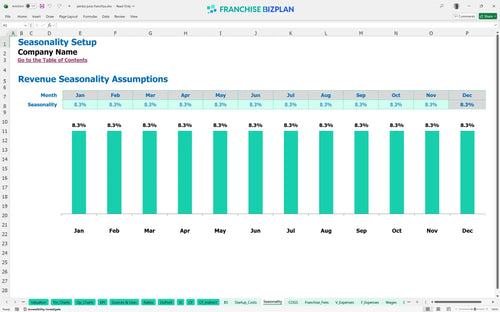
Researched revenue assumptions

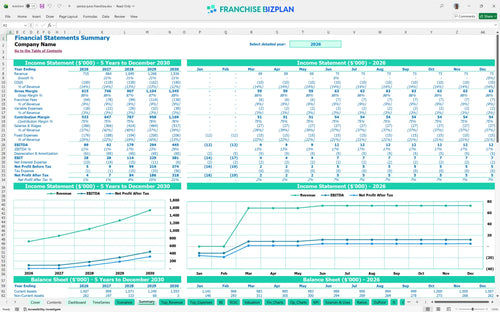
Lender-friendly financial outputs
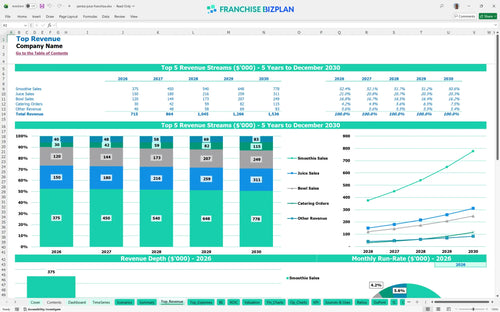
Revenue stream detailed view
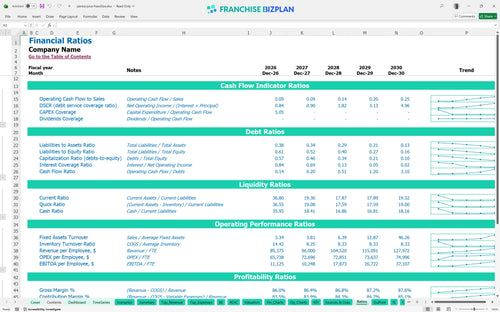
Performance metrics benchmark
We developed this franchise unit financial model through extensive research into the unit economics of health-focused retail concepts. The assumptions for revenue streams like smoothie and bowl sales, along with fixed costs like $10,000 prime location rent, are pre-populated and fully editable to match your specific territory. With a projected year-one EBITDA of $89,000, this model provides a credible foundation for your investment analysis.
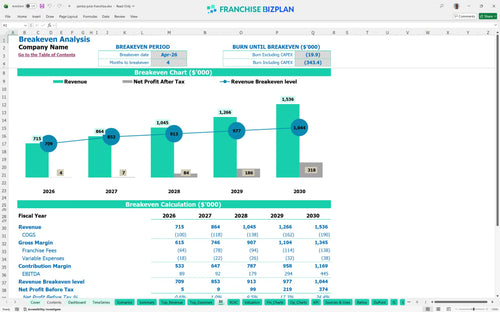
The unit reaches operating profitability almost immediately, with a formal break-even date of April 2026, just four months after launch. By year three, the franchise profitability analysis shows EBITDA climbing to $179,000 as catering and bowl sales scale. Profit is a marathon, not a sprint.
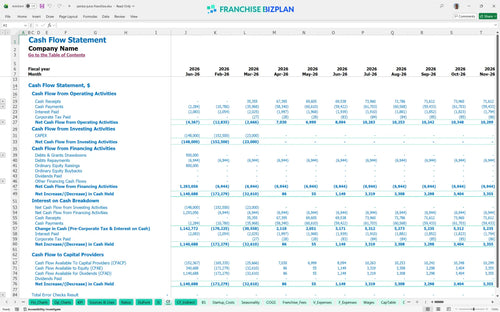
Your franchise startup cost calculator indicates a total capital need of approximately $1,259,500. This includes $323,500 for physical development and a significant $936,000 cash buffer to handle the March 2026 low point. Cash is king, but allocation is the kingdom.
This franchise investment analysis spreadsheet for small business projects a 5-year payback period and an IRR of 2.87%. While the initial cash outlay is high, the ROE of 0.75 and the climb to $445,000 EBITDA by year five show a strong equity-building trajectory. Patience pays when the margins are right.
You will reach the break-even point in April 2026, which is month four of operations. The operating expense breakdown for smoothie shop franchise units shows that managing the 14% combined COGS and 9% franchise fees is vital to hitting this date. Speed to break-even is the best de-risking tool you have.
The financial feasibility study for retail franchise startup identifies March 2026 as the lowest cash point at $936,000. You have a substantial buffer, but you must monitor the timing of the $120,000 leasehold payments to avoid liquidity gaps. The lowest cash point is your most vulnerable moment.
Using this financial model for quick-service restaurant franchise planning, you can see that hitting the high-growth scenario moves year-five revenue to $1.536 million. Forecasting monthly sales for a new franchise location allows you to see how a 10% dip in traffic would delay your payback past the 5-year mark. Scenarios are just stress tests for your sanity.
This franchise financial model template is a flexible Excel tool designed for precision. You can adjust every variable from smoothie prices to hourly wages, and the pre-filled formulas update instantly to show your new bottom line. It is defintely the most efficient way to build a custom smoothie franchise business plan without starting from a blank sheet. Customization is the difference between a generic guess and a bankable plan.

Success in the health food space requires looking past the grand opening. This franchise unit financial projection maps out your journey from the first $715,000 revenue year to a mature $1.5 million operation by year five. It tracks how scaling your crew from 4 to 6 full-time equivalents impacts your store-level margin over time. Five years is a lifetime in retail, so we build for the long haul.

We built a specific template for estimating franchise royalty and marketing fees to ensure you never overlook these recurring costs. The model automatically calculates the 6% royalty and 3% marketing fund contribution against your monthly sales, showing exactly how much cash stays in your local pocket. This level of detail helps you manage the 9% top-line drag effectively. Royalties are a top-line tax that never sleeps.

Calculating break-even point for a new franchise unit is the first step in de-risking your investment. This business model template for franchise operations breaks down your $10,000 monthly rent and $1,900 utility bills to find the exact daily ticket count you need to stay in the black. You can see how food costs starting at 12% affect your path to the April 2026 break-even date. Knowing your floor is just as important as knowing your ceiling.

This model uses real-world franchise unit performance metrics to help you sanity-check your expectations. We include researched costs for everything from $1,100 property insurance to $600 cleaning services so your budget reflects actual market rates. Comparing your projected $89,000 year-one EBITDA against these benchmarks ensures your plan is grounded in reality. Don't fly blind when you can use proven flight paths.


Simply purchase and download the financial model template, then access it instantly using Microsoft Excel or Google Sheets. No installation or technical expertise required-just open and start working.

Enter your business-specific numbers, including revenue projections, costs, and investment details. The pre-built formulas will automatically calculate financial insights, saving you time and effort.

Leverage the investor-ready format to confidently showcase your financial projections to banks, franchise representatives, or investors. Impress stakeholders with clear, data-driven insights and professional reports.

Leverage the investor-ready format to confidently present your projections to banks, franchise representatives, or investors.