
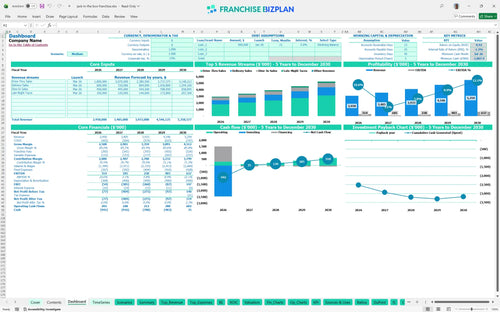
All-in-one Dashboard
Core inputs and core outputs


This Excel spreadsheet for franchise investment analysis provides a complete toolkit for evaluating unit-level performance and cash flow.
Core inputs and core outputs
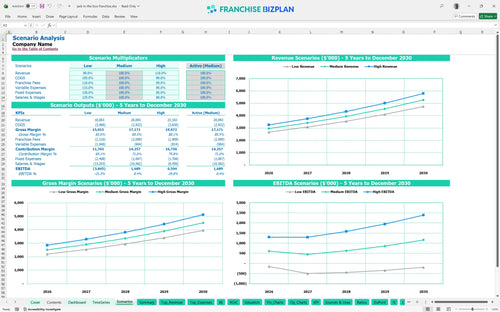
Three scenario analysis
Presentation ready
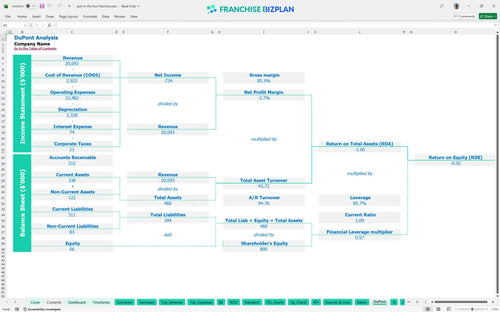
DuPont analysis
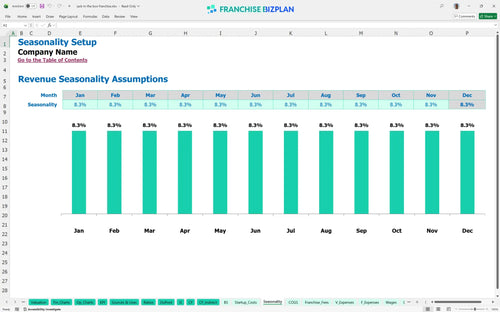
Researched revenue assumptions
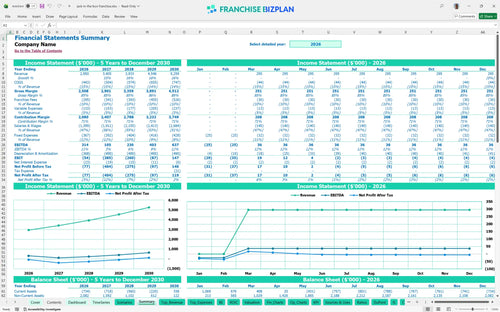
Lender-friendly financial outputs
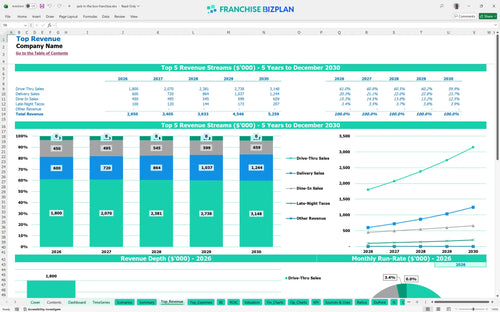
Revenue stream detailed view
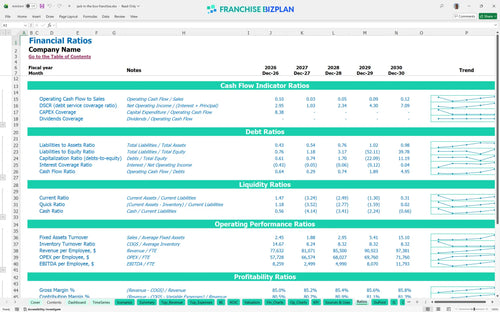
Performance metrics benchmark
We built this franchise unit financial model using our own research into high-volume QSR operations. Key assumptions like the $1.2M drive-thru revenue and 24/7 staffing levels are pre-populated and fully editable to match your specific territory. This tool helps you project revenue for 24 hour fast food restaurant units with precision.
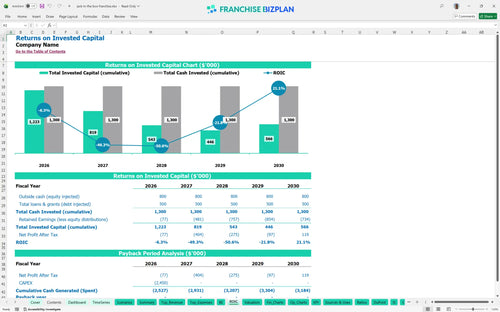
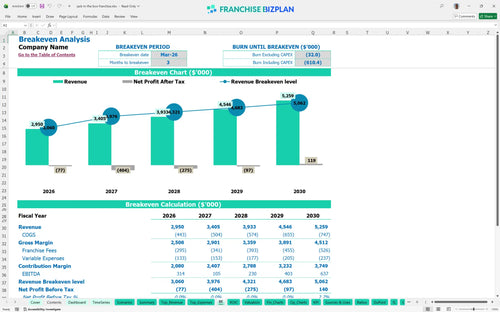
Based on our research, this unit hits a technical break-even in March 2026, just three months after launch. However, EBITDA fluctuates, dropping from $314,000 in year one to $105,000 in year two as staffing scales up. You will need to manage the fast food franchise profit and loss statement template closely to ensure year-five EBITDA reaches the projected $637,000.
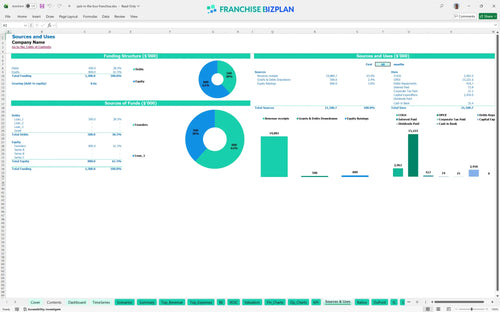
You need significant liquidity to start, with a capital expenditure budget exceeding $2.4M. Major costs include $1,000,000 for leasehold improvements and $500,000 for kitchen equipment. The model also accounts for a $50,000 franchise fee and $350,000 for drive-thru infrastructure to handle high-volume traffic.
The ROI calculation for drive-thru restaurant business shows a challenging start with an IRR of -1.19%. Because of the heavy upfront investment, full payback occurs after the five-year mark. This is a long-term play where value is built through consistent multi-unit growth rather than a quick flip.
To cover your $22,000 monthly rent and 10% combined franchise fees, you need to hit your stride early. The franchise location profitability forecast depends heavily on drive-thru volume, which is projected at $1.2M in year one. If throughput lags, your break-even date will slip past the projected three-month window.
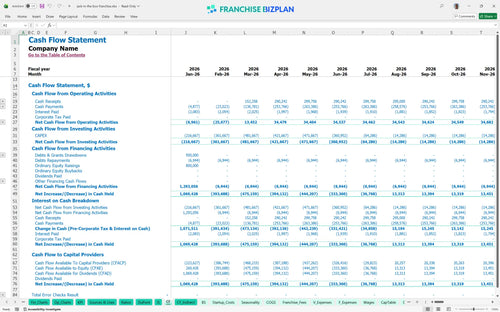
The lowest cash point hits -$1,008,000 in July 2026, meaning you need a deep reserve or solid financing. Estimating labor costs for 24/7 restaurant operations is tricky; if you overstaff during slow overnight hours, your runway disappears. You'll defintely need a cash buffer to handle the ramp-up period.
A financial feasibility study for QSR franchise must look at the 'what ifs.' In a high-growth scenario, pushing delivery sales toward the $829,000 mark by year five significantly improves the IRR. Conversely, a low-volume scenario makes the $22,000 monthly rent a massive burden that could delay profitability by years.
This franchise financial model template is built in Excel to let you swap out assumptions as your local market changes. You can adjust everything from hourly wages to food costs, making it a flexible fast food franchise business plan tool. It handles the heavy lifting with pre-set formulas so you can focus on the actual strategy.

Mapping out a restaurant franchise financial projections plan requires looking past the first year of excitement. This model tracks your trajectory from an initial $2,950,000 in sales up to $5,259,000 by year five. It gives you a clear view of how scaling volume impacts your bottom line over the long haul.

Royalties and marketing funds are non-negotiable 'off-the-top' costs that eat into your QSR franchise profitability analysis. At 5% for royalties and 5% for marketing, you are sending 10 cents of every dollar back to headquarters. This model ensures these royalty fees are calculated accurately against every sales channel, from drive-thru to delivery.

Knowing how to calculate startup costs for a fast food franchise is the difference between opening and staying open. With a $50,000 initial fee and over $1,000,000 in leasehold improvements, the entry price is steep. Our break-even analysis shows you exactly what daily volume you need to cover these high fixed costs.

We include standard benchmarks so you can see if your 12% food ingredient cost is realistic or a pipe dream. Comparing your operational overhead against industry norms helps you spot margin leaks before they become floods. It's a sanity check for your franchise startup cost calculator.


Simply purchase and download the financial model template, then access it instantly using Microsoft Excel or Google Sheets. No installation or technical expertise required-just open and start working.

Enter your business-specific numbers, including revenue projections, costs, and investment details. The pre-built formulas will automatically calculate financial insights, saving you time and effort.

Leverage the investor-ready format to confidently showcase your financial projections to banks, franchise representatives, or investors. Impress stakeholders with clear, data-driven insights and professional reports.

Leverage the investor-ready format to confidently present your projections to banks, franchise representatives, or investors.