
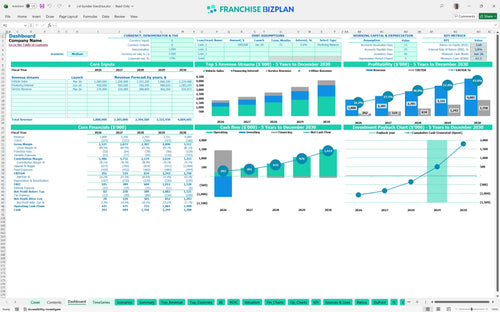
All-in-one Dashboard
Core inputs and core outputs


This Excel spreadsheet for franchise unit financial forecasting includes detailed revenue drivers, staffing plans, and a complete capital expenditure schedule for managing a used car dealership.
Core inputs and core outputs
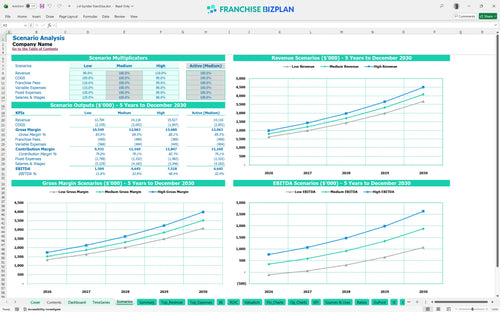
Three scenario analysis
Presentation ready
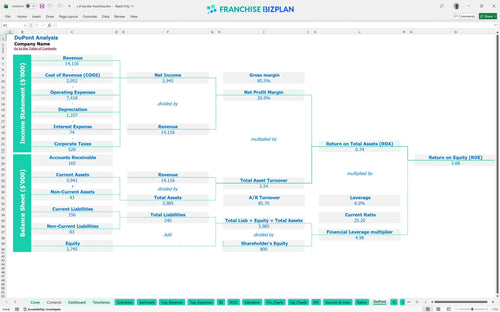
DuPont analysis
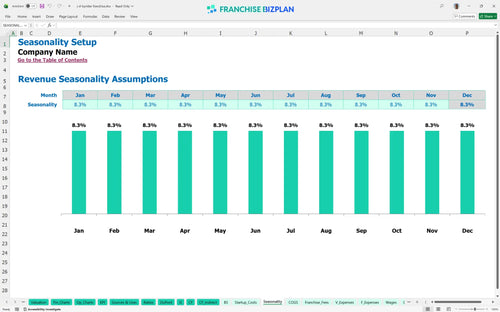
Researched revenue assumptions
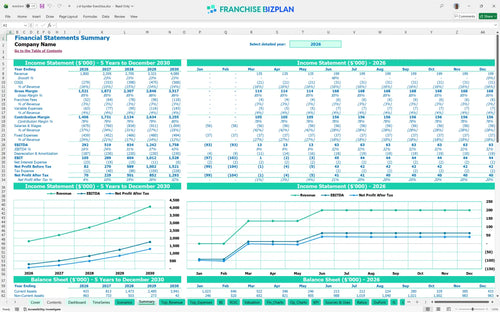
Lender-friendly financial outputs
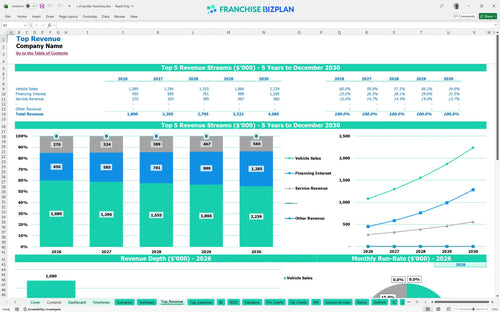
Revenue stream detailed view
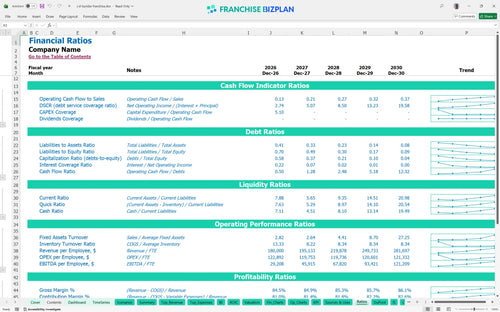
Performance metrics benchmark
We built this franchise unit financial model using our own research to help you navigate the complexities of subprime auto lending. Key assumptions like the $1.8 million year-one revenue and 2.9% royalty are pre-populated and fully editable to reflect your specific market. Honestly, having these numbers ready makes estimating loan portfolio risk in auto financing much more manageable for any new owner. The model does the heavy lifting so you can focus on selling cars.
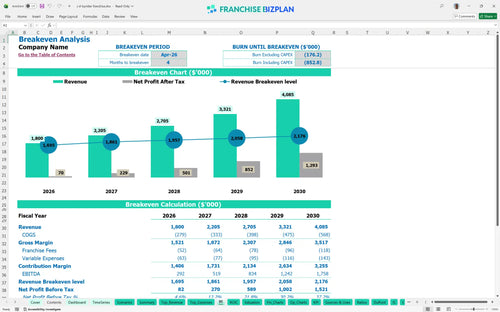
The unit reaches profitability in its first year, generating $292,000 in EBITDA after accounting for vehicle costs and the 2.9% royalty. By year five, buy here pay here dealership profit margins scale to $1.758 million as the loan portfolio matures. Every dollar saved in reconditioning is a dollar added to your bottom line.
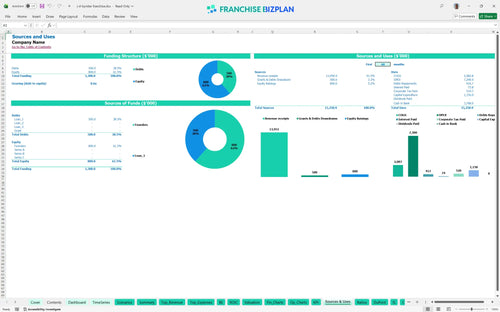
You will need approximately $1.15 million to get the doors open, which covers the franchise fee and major capital expenditure planning like the $400,000 leasehold build-out. This is how to calculate startup costs for a used car franchise effectively without missing hidden pre-opening expenses. Cash is king, especially when you are building a loan portfolio from scratch.
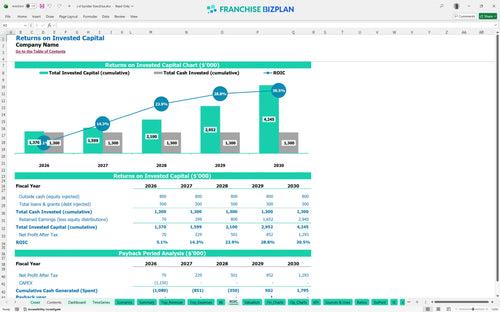
Investors can expect a 3.77% internal rate of return and a 3.68% return on equity over the five-year period. The model shows a four-year payback period, meaning you recover your initial investment through steady vehicle sales and financing interest. A four-year payback is a marathon, but the interest income makes the finish line worth it.
The dealership hits its monthly break-even point in April 2026, just four months after launching. Managing operational costs for a subprime auto dealership, especially the $25,000 monthly rent, is the biggest factor in hitting this milestone quickly. Speed to break-even is the best hedge against early-stage risk.
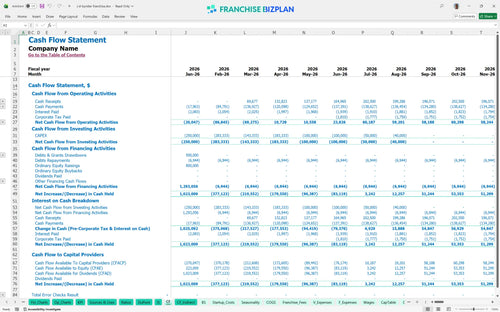
The lowest cash point occurs in June 2026, with a minimum balance of $67,000. Revenue forecasting for buy here pay here businesses shows you need enough working capital to bridge the gap between opening in March and the full ramp-up of financing interest. A $67,000 cushion isn't much, so watch those early disbursements closely.
Using the franchise business plan template for car dealerships, you can see how the $1.758 million year-five EBITDA shifts under different conditions. Best practices for franchise unit profitability analysis suggest that the high case depends heavily on local marketing execution and inventory turnover. High-case performance is won in the local service bays and sales floor, not the spreadsheet.
This franchise financial model template is built in Excel, allowing you to tweak every variable from vehicle sales volume to reconditioning costs. You can adjust the pre-filled formulas to match your specific territory or local market conditions without needing to be a spreadsheet pro. You don't need to be a spreadsheet guru to get professional-grade results.

The model maps out a five-year growth path, showing revenue scaling from $1.8 million in year one to over $4 million by year five. It provides a clear look at how your buy here pay here financial projections translate into long-term automotive retail financial forecasting and sustainable cash flow. Long-term planning is about seeing the forest and the trees simultaneously.

Managing ongoing costs is simple with dedicated inputs for the 2.9% royalty fee and the initial $50,000 franchise fee. This ensures your franchise profitability analysis accounts for every dollar sent to the franchisor, keeping your store-level margins transparent and accurate. Transparency in royalty tracking prevents nasty surprises at the end of the quarter.

This franchise investment calculator helps you plan a dealership startup cost spreadsheet by totaling leasehold improvements, equipment, and working capital. With a projected break-even in just four months, you can see exactly how many vehicle sales are needed to cover your $25,000 monthly rent. Knowing your break-even date is the first step toward financial freedom.

The model uses real-world data for subprime auto lending to set benchmarks for labor, such as the $110,000 general manager salary and $48,000 technician pay. These figures help you sanity-check your auto dealership business plan against standard BHPH dealership operations and typical gross margin ranges. Benchmarking against the pros keeps your assumptions grounded in reality.


Simply purchase and download the financial model template, then access it instantly using Microsoft Excel or Google Sheets. No installation or technical expertise required-just open and start working.

Enter your business-specific numbers, including revenue projections, costs, and investment details. The pre-built formulas will automatically calculate financial insights, saving you time and effort.

Leverage the investor-ready format to confidently showcase your financial projections to banks, franchise representatives, or investors. Impress stakeholders with clear, data-driven insights and professional reports.

Leverage the investor-ready format to confidently present your projections to banks, franchise representatives, or investors.