
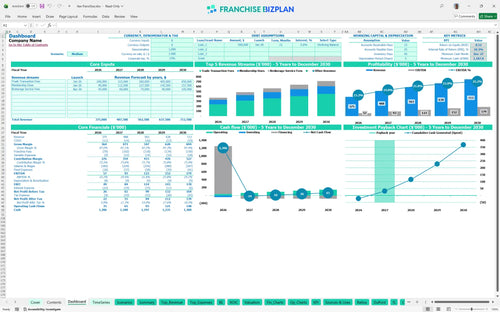
All-in-one Dashboard
Core inputs and core outputs


This comprehensive franchise business plan template includes detailed revenue forecasting, a franchise startup cost calculator, and a full operational cost analysis for franchise units.
Core inputs and core outputs
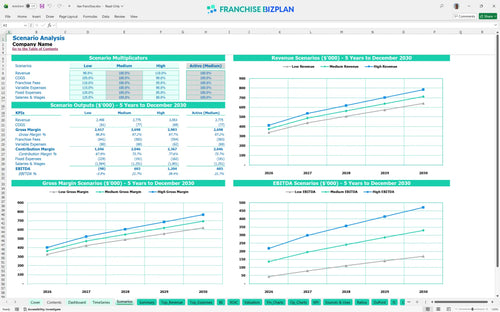
Three scenario analysis
Presentation ready
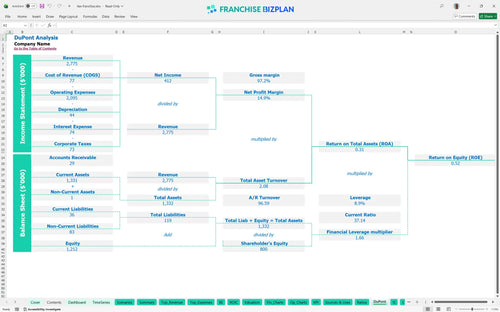
DuPont analysis
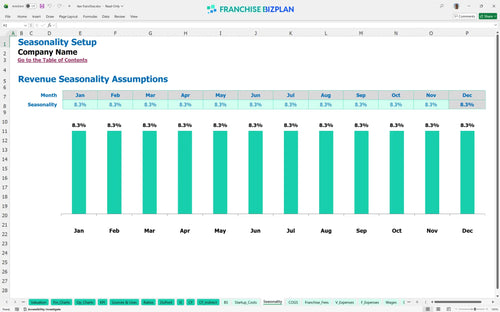
Researched revenue assumptions
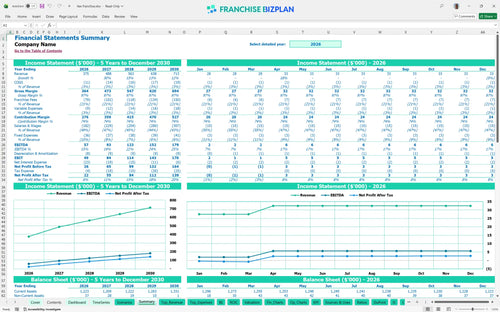
Lender-friendly financial outputs
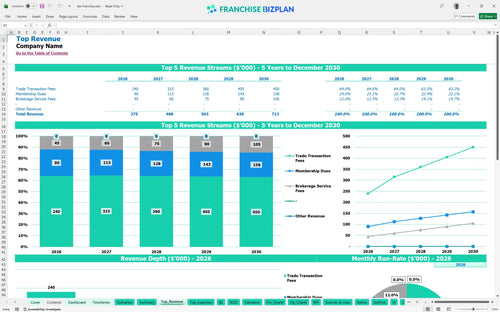
Revenue stream detailed view
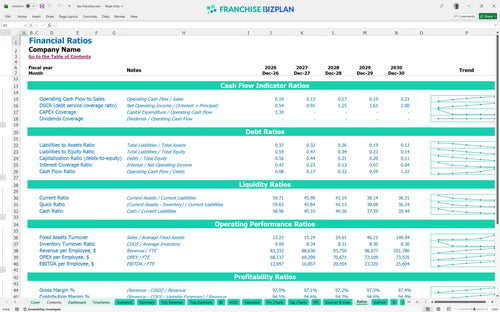
Performance metrics benchmark
This financial forecasting for B2B barter network was built using deep-dive research into the service-based brokerage sector to ensure accuracy. We pre-populated the model with specific data points, including a $10,000 initial fee and a 20% royalty, while projecting Year 1 EBITDA at $57,000. Every assumption, from Trade Transaction Fees to your office fitout costs, is fully editable to reflect your local market conditions.
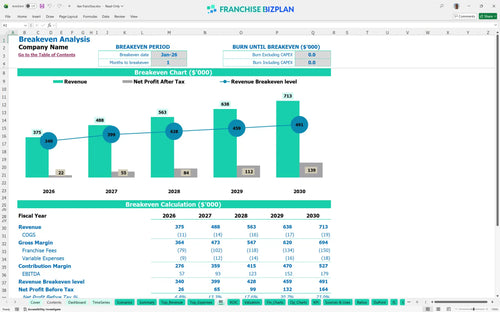
The unit reaches profitability almost immediately, with a break-even date in January 2026. This franchise profitability analysis shows EBITDA growing from $57,000 in Year 1 to $179,000 by Year 5 as you scale trade volume through the Austin business corridor.
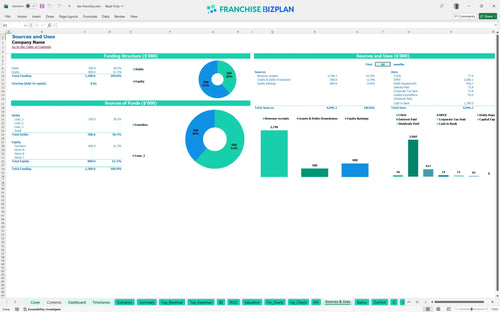
You will need a total startup investment that covers the $10,000 franchise fee and roughly $45,000 in initial CAPEX. This franchise unit startup budget template excel tracks every dollar from office fitout to your first month of marketing to ensure you are never caught off guard.
Calculating ROI for new franchise investment reveals an Internal Rate of Return of 10.23% and a Return on Equity of 0.52. The model defintely shows that you can expect a full payback of your initial capital within 2 years of operation, which is strong for a service-based business. These profitability metrics for service-based franchises help you evaluate the long-term potential of the territory.
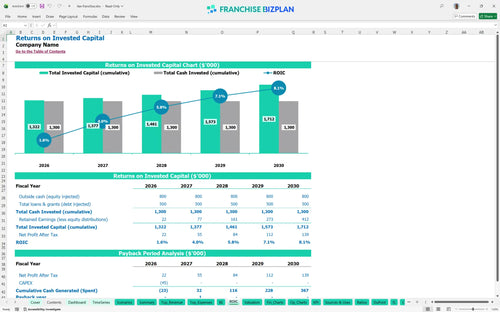
The monthly break-even point is reached in month 1, provided you hit the $31,250 monthly revenue target. The 20% franchise royalty structure is the biggest overhead driver, making high-velocity trade volume the primary lever for your store-level margin.
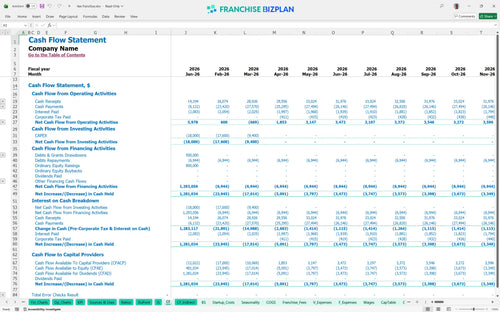
The operational cost analysis for franchise units indicates your lowest cash point will be $1,188,000 in December 2027. While this suggests a massive liquidity cushion, you should still maintain tight control over your monthly operational expenses to ensure long-term stability during the ramp-up phase.
The Excel template for franchise financial projections allows you to toggle between Low, Medium, and High growth cases for your business plan for local brokerage franchise. In the High scenario, Year 5 revenue hits $713,000, significantly increasing the store-level margin and long-term valuation of the unit. This helps you prepare for varying market conditions in the Austin area.
Finance: update unit break-even and payback model by Friday
This franchise financial model is fully customizable in Excel, showing you how to build a financial model for a franchise unit by adjusting every variable from trade volume to local rent. You can easily modify pre-filled formulas to reflect your specific territory and operational reality without needing advanced accounting skills.

The model provides a clear five-year outlook to help you visualize how the barter network franchise scales from initial launch to a mature territory. It tracks revenue forecasting across multiple streams, ensuring you can plan for long-term profitability and sustainable cash flow as your member base grows.

This model provides a detailed franchise fee and royalty structure breakdown, focusing on the 20% royalty and 1% brand marketing fund contributions. Understanding these ongoing obligations is critical for a B2B networking business where top-line trade volume must support significant franchisor fees before store-level profit.

This section explains how to estimate franchise startup and operating costs, helping you plan for the $10,000 initial fee and the total $45,000 capital expenditure. By mapping out fixed and variable costs, you can identify the exact revenue level needed to reach the break-even point in your local market.

The model incorporates built-in franchise and industry benchmarks for key operating metrics, allowing you to sanity-check your labor and occupancy costs. Comparing your projected performance against typical gross margin ranges for B2B brokerage services ensures your business plan stays grounded in reality.


Simply purchase and download the financial model template, then access it instantly using Microsoft Excel or Google Sheets. No installation or technical expertise required-just open and start working.

Enter your business-specific numbers, including revenue projections, costs, and investment details. The pre-built formulas will automatically calculate financial insights, saving you time and effort.

Leverage the investor-ready format to confidently showcase your financial projections to banks, franchise representatives, or investors. Impress stakeholders with clear, data-driven insights and professional reports.

Leverage the investor-ready format to confidently present your projections to banks, franchise representatives, or investors.