
All-in-one Dashboard
Core inputs and core outputs


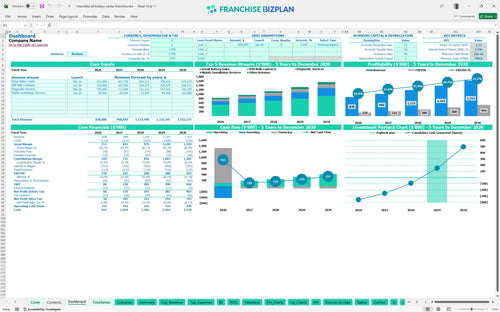
This business plan financial model for franchise investors includes a complete set of pro forma statements, automated dashboards, and specific unit-level drivers for a retail battery operation.
Core inputs and core outputs
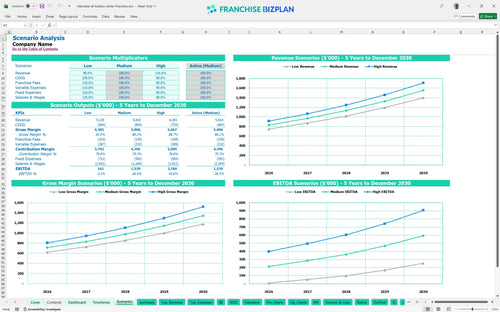
Three scenario analysis
Presentation ready
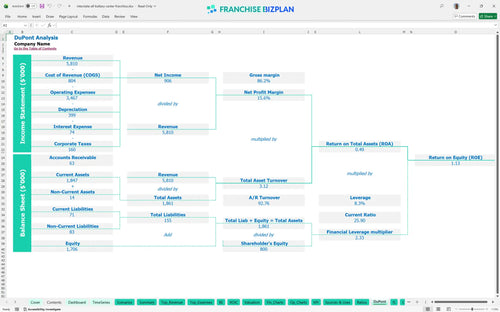
DuPont analysis
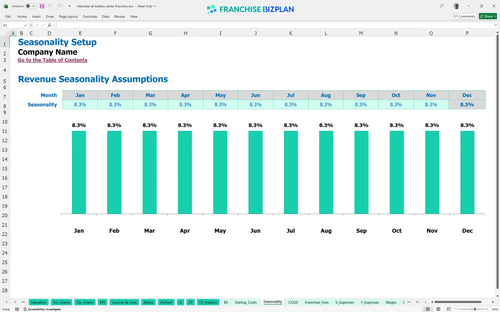
Researched revenue assumptions
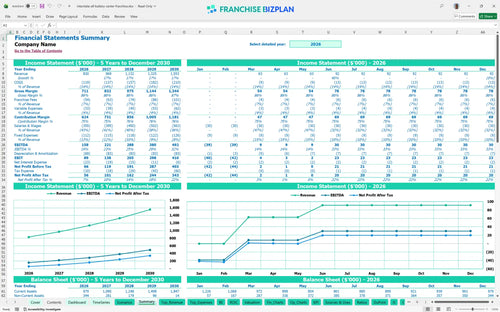
Lender-friendly financial outputs
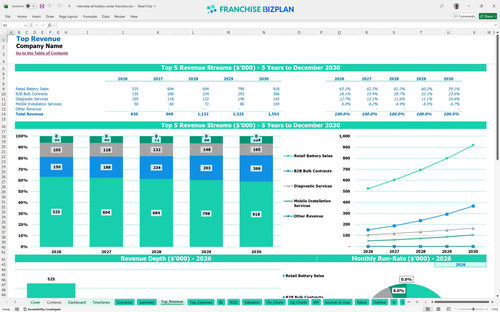
Revenue stream detailed view
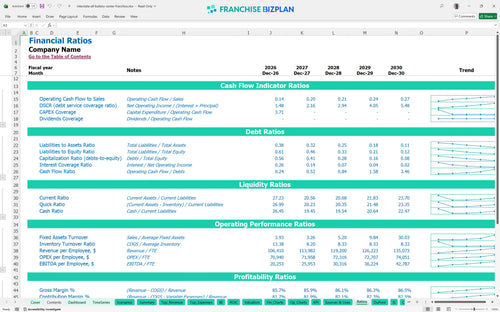
Performance metrics benchmark
We built this financial model using deep research into the battery retail sector to ensure every line item is grounded in reality. Key assumptions, including the $350,000 retail revenue base and the $55,000 mobile service vehicle investment, are pre-populated and fully editable. This tool defintely helps you visualize how a $158,000 Year 1 EBITDA can scale as you ramp up B2B contracts and diagnostic services.
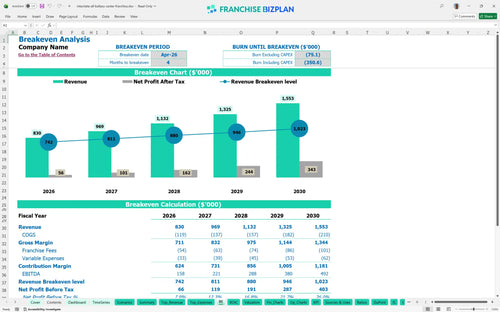
The unit reaches operational profitability very quickly, hitting its break-even point in April 2026, just four months after opening. When evaluating profitability of a battery franchise unit, you'll see Year 1 EBITDA starts at $158,000 and climbs steadily as B2B bulk contracts and mobile services begin to contribute to the bottom line.
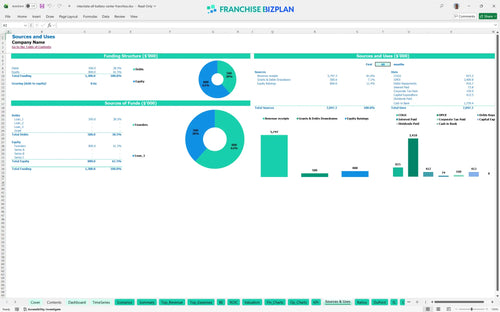
To launch this unit in the US, you need to plan for startup capital requirements that cover both the physical storefront and mobile capabilities. The total initial investment includes a $37,500 franchise fee, $120,000 for leasehold improvements, and $75,000 for specialized equipment, plus a cash buffer to reach the $796,000 minimum cash point.
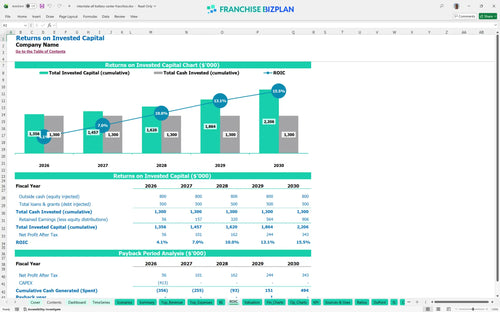
Based on the current projections, you can expect a 4-year payback period on your total investment. The franchise ROI calculator shows an Internal Rate of Return (IRR) of 3.73% and a Return on Equity (ROE) of 1.13, reflecting a stable business model that prioritizes long-term cash flow and equity building over high-risk, short-term gains. This franchise investment analysis suggests a mature, predictable growth curve.
This Excel template for franchise financial projections shows you hit the break-even point in April 2026. Your biggest hurdles are the $6,000 monthly rent and the 6.5% combined royalty and marketing fee. To stay ahead, you must maintain a high average ticket through specialized battery sales and diagnostic service fees.
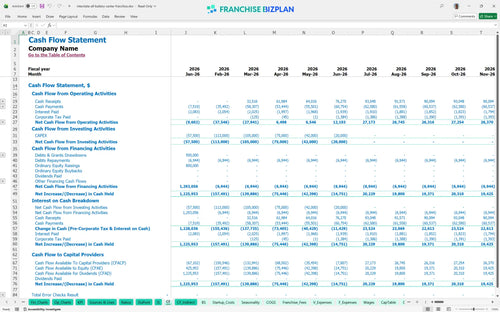
The model identifies June 2026 as your lowest cash point, with a balance of $796,000. These financial planning tools for prospective franchise owners highlight the importance of maintaining a significant liquidity buffer to cover the $120,000 in build-out costs and the initial $60,000 inventory load before the B2B revenue streams fully mature.
This financial forecasting guide for new franchise owners allows you to toggle between Low, Medium, and High scenarios to see how a 10% shift in retail traffic affects your Year 1 margin. In the High case, aggressive B2B sales representation can push Year 5 revenue toward $1.55 million, significantly shortening your payback period and increasing your annual take-home pay.
This franchise financial model template is built in Excel to give you total control over your numbers. It features a franchise unit economics model with pre-filled formulas and editable assumptions, so you can easily adjust for your specific territory, local rent prices, and labor market conditions without starting from scratch.

Success in retail requires looking past the first year of operations. This small business financial forecasting tool provides a detailed 5-year outlook, showing how revenue can grow from $830,000 in Year 1 to over $1.55 million by Year 5. Use the profitability projection spreadsheet to track your long-term path to a $492,000 annual EBITDA.

Managing your relationship with the franchisor means staying on top of your ongoing obligations. This retail franchise business plan model automatically calculates the 5% royalty and 1.5% marketing fund contributions based on your sales. Analyzing recurring revenue streams for retail franchises is much easier when these fixed percentages are baked into your monthly cash flow projections.

Knowing exactly how to calculate startup costs for a retail franchise is the first step to securing funding. This franchise startup cost calculator includes everything from the $37,500 initial fee to the $120,000 leasehold budget. It maps out your total investment so you can see exactly when your monthly sales will cover your $6,000 rent and other fixed overhead.

We've integrated retail store operating expenses and performance benchmarks to help you sanity-check your plan. This retail franchise unit economics and ROI analysis tool uses researched data, such as battery inventory costs starting at 12.5% of sales, to ensure your margins are realistic for the sector. It's a gut check for your labor and occupancy assumptions.


Simply purchase and download the financial model template, then access it instantly using Microsoft Excel or Google Sheets. No installation or technical expertise required-just open and start working.

Enter your business-specific numbers, including revenue projections, costs, and investment details. The pre-built formulas will automatically calculate financial insights, saving you time and effort.

Leverage the investor-ready format to confidently showcase your financial projections to banks, franchise representatives, or investors. Impress stakeholders with clear, data-driven insights and professional reports.

Leverage the investor-ready format to confidently present your projections to banks, franchise representatives, or investors.