
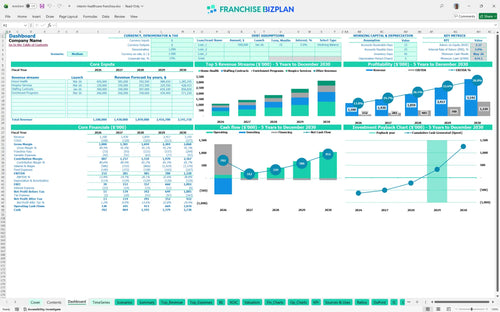
All-in-one Dashboard
Core inputs and core outputs


This comprehensive Excel template provides a detailed roadmap for evaluating a home health care franchise investment through integrated financial statements and operational drivers.
Core inputs and core outputs
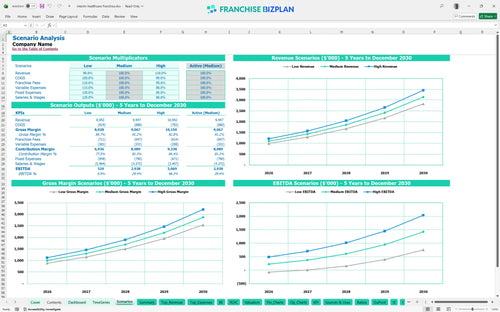
Three scenario analysis
Presentation ready
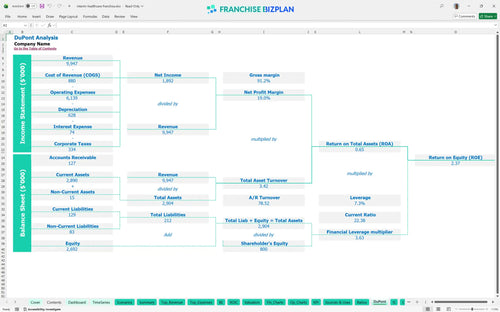
DuPont analysis
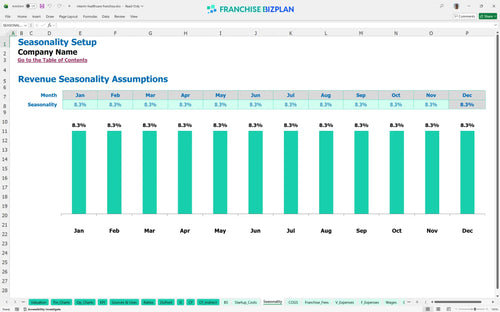
Researched revenue assumptions
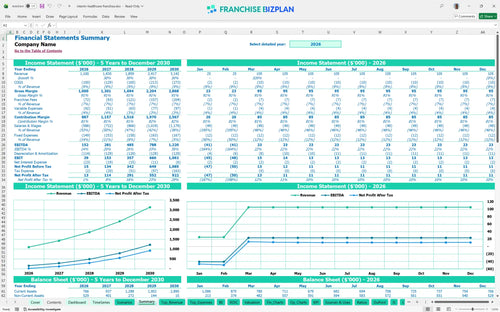
Lender-friendly financial outputs
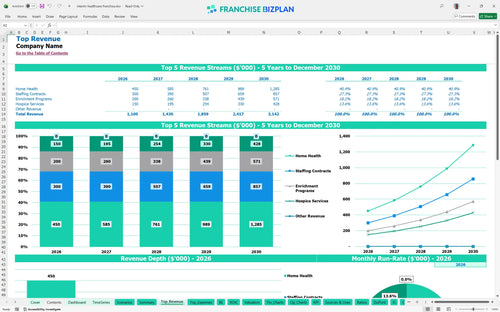
Revenue stream detailed view
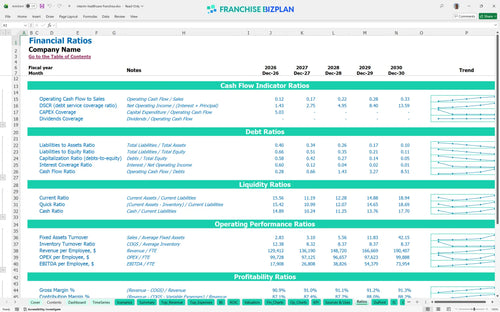
Performance metrics benchmark
We built this home health care franchise financial model using our own research into post-acute care business models. Key assumptions, such as the $1.1M year-one revenue and the $6,000 monthly rent, are pre-populated but fully editable to match your specific location. This tool defintely helps you visualize the path from a $643,000 initial investment to a $1.2M EBITDA by year five.
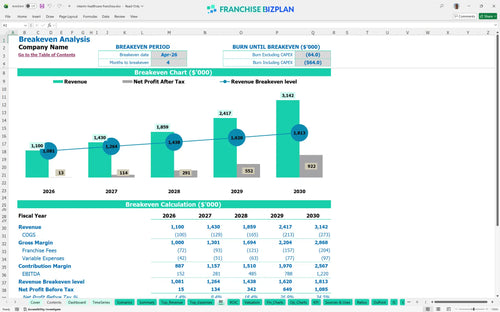
The unit reaches operational break-even in April 2026, just four months after the January launch. By year two, EBITDA reaches $281,000 as the revenue mix from home health and staffing contracts scales toward the $3.1M year-five target.
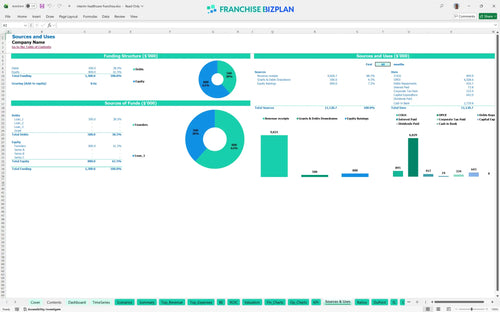
You need approximately $643,000 to launch this franchise unit in the US. This total initial investment includes the $75,000 franchise fee, $180,000 for leasehold improvements, and $120,000 for the hub buildout required for clinical coordination.
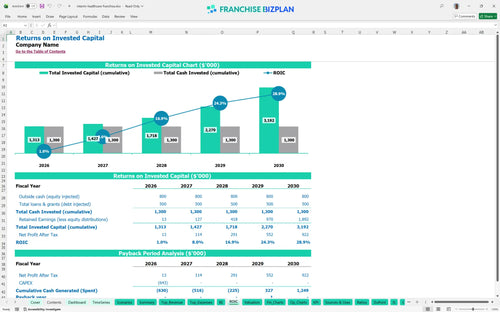
Investors can expect a 4-year payback period with an internal rate of return (IRR) of 3.95%. While the initial return on equity is 2.37, the long-term ROI is driven by the significant ramp-up in EBITDA from $152,000 in year one to over $1.2M by year five.
The monthly break-even revenue level is approximately $92,000. Reaching this point depends heavily on managing labor costs, specifically the $110,000 Director of Nursing salary and the scaling of Registered Nurse FTEs as patient volume grows.
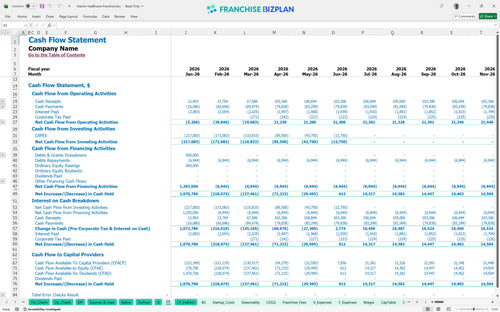
The lowest cash point is $614,000, occurring in May 2026. You need a solid cash buffer to handle the delay between providing care and receiving reimbursements, especially during the first six months of operation.
A high-revenue scenario significantly improves the 4-year payback by spreading fixed costs like the $85,000 Branch Administrator salary over more billable hours. In contrast, a low scenario increases peak cash needs and delays the April 2026 break-even date.
Finance: update unit break-even and payback model by Friday
This franchise unit financial model is fully customizable in Excel, featuring pre-filled formulas and editable assumptions that allow you to adapt the tool to your specific territory. You can easily modify local market data, service mix, and operating scenarios to see how different variables impact your bottom line.

Plan for long-term growth with detailed 5-year revenue, cost, cash flow, and profit projections tailored for a medical staffing franchise business. This home health business plan view helps you visualize the transition from a startup phase to a mature, multi-service healthcare operation.

The model accurately captures franchise-specific financial obligations, including the initial investment and ongoing fees. By tracking the 5.5% royalty and 1% marketing fund contributions, you can understand the real economics of the healthcare revenue cycle management and store-level margins.

Estimate your total initial investment by aggregating build-out costs, equipment, and working capital. This franchise ROI calculator identifies the specific sales volume and timeline required to cover your fixed and variable costs, providing a clear path to operational sustainability.

The model incorporates built-in franchise unit economic analysis for home health, allowing you to sanity-check your projections against typical industry ranges. Compare your labor costs and medical supply expenses against established standards to ensure your financial planning is realistic and competitive.


Simply purchase and download the financial model template, then access it instantly using Microsoft Excel or Google Sheets. No installation or technical expertise required-just open and start working.

Enter your business-specific numbers, including revenue projections, costs, and investment details. The pre-built formulas will automatically calculate financial insights, saving you time and effort.

Leverage the investor-ready format to confidently showcase your financial projections to banks, franchise representatives, or investors. Impress stakeholders with clear, data-driven insights and professional reports.

Leverage the investor-ready format to confidently present your projections to banks, franchise representatives, or investors.