
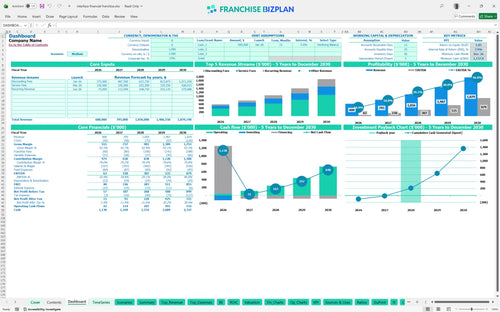
All-in-one Dashboard
Core inputs and core outputs


This comprehensive franchise business plan template includes dynamic Excel tabs for revenue forecasting, startup capital requirements, and detailed profit and loss statements tailored for financial services.
Core inputs and core outputs
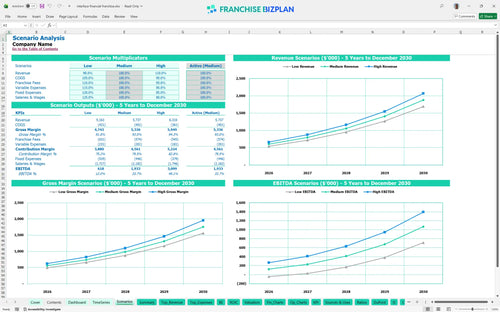
Three scenario analysis
Presentation ready
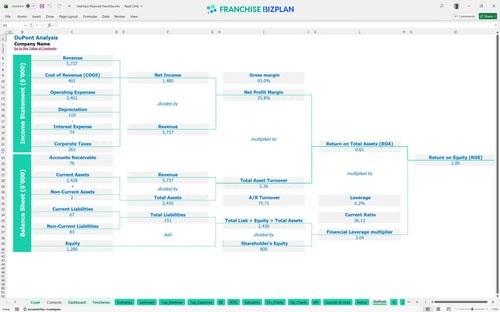
DuPont analysis
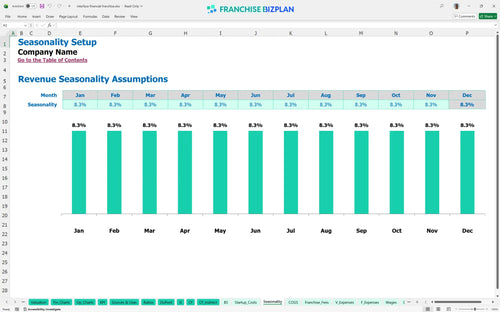
Researched revenue assumptions
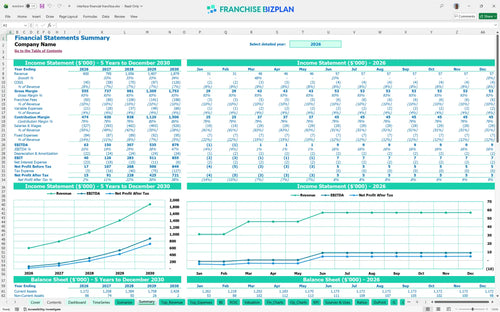
Lender-friendly financial outputs
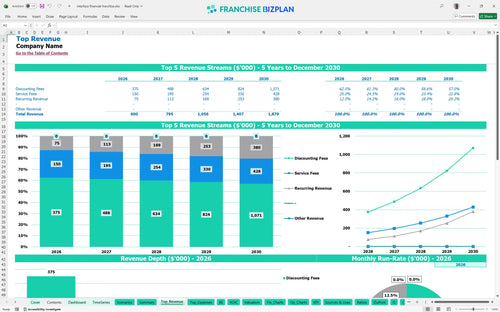
Revenue stream detailed view
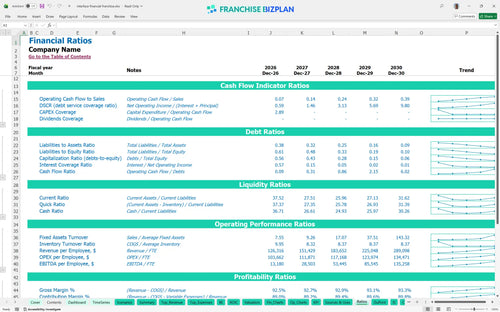
Performance metrics benchmark
We built this franchise unit financial model using detailed research into the invoice discounting business model. Key assumptions including Year 1 revenue of $600,000, an 8% royalty fee, and specific staffing costs for a Principal and Operations Manager are pre-populated and fully editable. This tool provides a clear financial feasibility study for new franchise owners looking to enter the alternative lending space.
This franchise unit shows immediate operational viability with an EBITDA of $63,000 in its first year. By Year 3, the model projects EBITDA to climb to $307,000 as discounting fees and recurring revenue streams scale. Profitability is achieved after accounting for a 5.5% cost of capital and 10% total franchise-related fees.
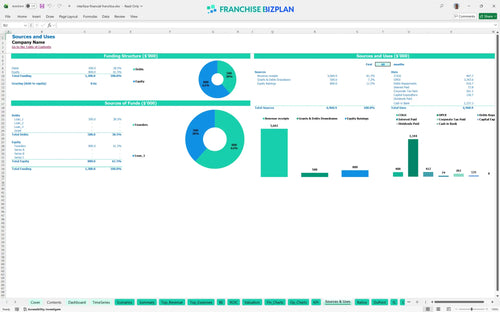
To launch this financial services franchise, you need approximately $120,700 in initial capital for fixed assets and fees. This includes the $39,000 franchise fee and $30,000 for office fit-out, plus a significant cash buffer for invoice purchases. The model helps you estimate startup costs for a financial services franchise by totaling all pre-opening and CAPEX requirements.
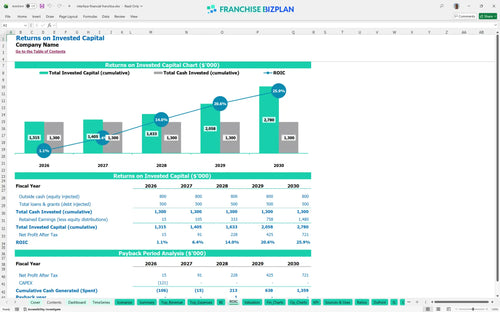
Investors can expect an Internal Rate of Return (IRR) of 7.9% and a Return on Equity (ROE) of 1.85 over the five-year period. The payback period for the initial investment is estimated at 3 years, which is standard for a professional services model. This Excel template for franchise unit cash flow projection makes it easy to visualize these long-term gains.
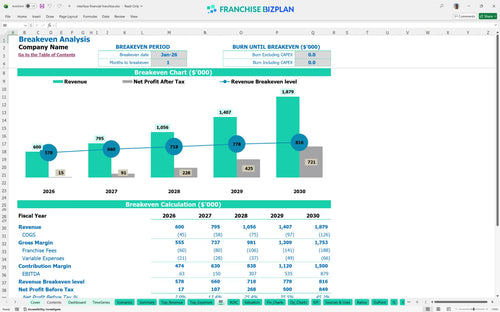
The unit is projected to reach its monthly break-even point in January 2026, just one month after launch. This rapid break-even is driven by the low overhead of the office-based model and the immediate generation of discounting fees. Maintaining a steady volume of invoice purchases is the primary lever for staying above this threshold.
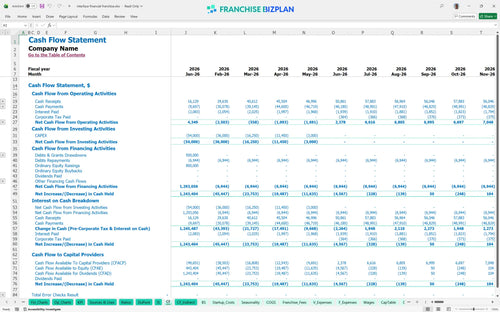
The lowest cash point is projected at $1,138,000 in December 2026, reflecting the capital-intensive nature of purchasing accounts receivable. You will need a robust working capital management spreadsheet to track the timing of invoice repayments versus new funding requests. Ensuring you have enough liquidity to handle peak demand is vital for the invoice factoring business.
The model compares growth scenarios where revenue scales from $600,000 in Year 1 to over $1.8 million by Year 5. In a high-growth scenario, increased throughput of service fees significantly improves the Year 1 margin and shortens the path to mature-unit performance. Using these financial forecasting spreadsheets for alternative lending allows you to stress-test your assumptions against market volatility.
This franchise financial model template is fully customizable in Excel, allowing you to swap out pre-filled data for your specific market conditions. You can edit the assumptions for revenue drivers and operating costs to defintely see how different scenarios impact your bottom line. It is a plug-and-play financial projection spreadsheet designed to handle the unique math of a service-based business.

Success in an alternative lending franchise requires looking beyond the first year of operations. This model provides a detailed 5-year view of your revenue, costs, and cash flow to help you plan for multi-unit expansion or long-term stability. By using this financial projection spreadsheet, you can track how your margin evolves as your portfolio of discounted invoices matures over time.

Operating a franchise means managing specific financial obligations like royalties and brand fund contributions that eat into your store-level margin. This model automatically calculates these costs based on your gross sales, so you always know exactly what is owed to the franchisor. It serves as a franchise profitability calculator that accounts for the 8% royalty and 2% marketing fee before you see your net take-home pay.

Before you sign a lease, you need a startup cost analysis template to estimate the total capital required for office fit-out and initial marketing. This tool helps you identify the exact sales volume needed to cover your fixed monthly costs like rent and payroll. Knowing your break-even point is critical for managing your working capital management spreadsheet during the early months of the business.

This model includes built-in benchmarks to help you sanity-check your small business financial forecasting against industry standards. You can compare your projected labor costs and occupancy expenses to ensure your business plan is realistic and fundable. It acts as a franchise ROI analysis tool that keeps your expectations grounded in real-world performance data.


Simply purchase and download the financial model template, then access it instantly using Microsoft Excel or Google Sheets. No installation or technical expertise required-just open and start working.

Enter your business-specific numbers, including revenue projections, costs, and investment details. The pre-built formulas will automatically calculate financial insights, saving you time and effort.

Leverage the investor-ready format to confidently showcase your financial projections to banks, franchise representatives, or investors. Impress stakeholders with clear, data-driven insights and professional reports.

Leverage the investor-ready format to confidently present your projections to banks, franchise representatives, or investors.