
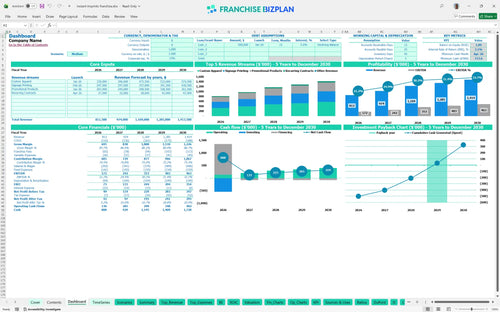
All-in-one Dashboard
Core inputs and core outputs


This comprehensive Excel tool provides a ready-to-use framework for projecting the revenue, expenses, and investment returns of a new custom branding and printing franchise unit.
Core inputs and core outputs
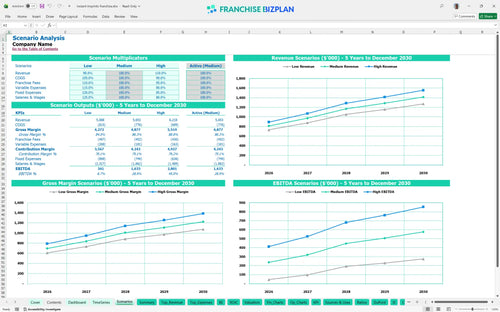
Three scenario analysis
Presentation ready
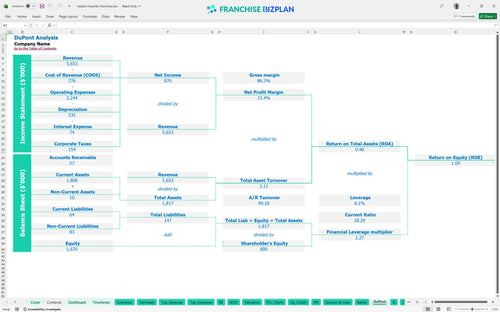
DuPont analysis
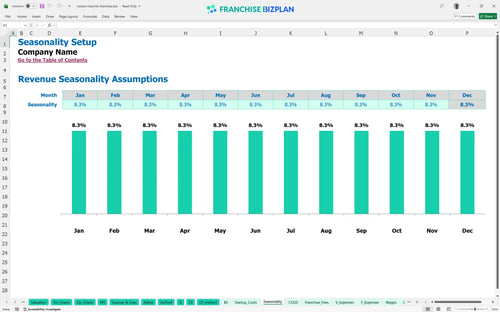
Researched revenue assumptions
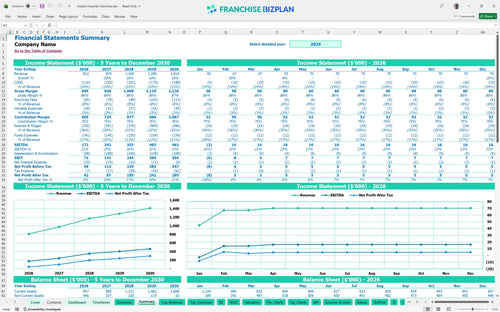
Lender-friendly financial outputs
Revenue stream detailed view
Performance metrics benchmark
We built this franchise unit financial model using our own research into the custom apparel and signage industry. Key assumptions, including the $812,000 Year 1 revenue and the $172,000 EBITDA, are pre-populated with researched data specific to this franchise concept and are fully editable. This tool defintely helps you visualize how the 6% royalty and 2% marketing fees impact your net cash flow from day one.
The unit reaches monthly break-even almost immediately in January 2026, provided you hit your initial sales targets. Net profit is calculated after accounting for 12.5% material costs, 6% royalties, and $6,500 in monthly rent.
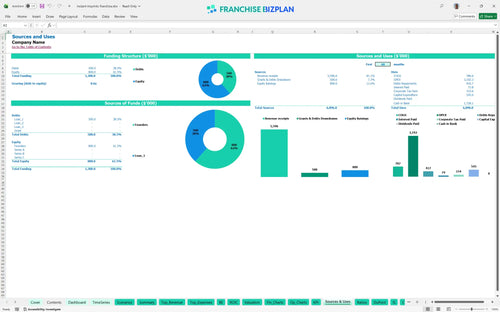
You need approximately $544,950 to launch, covering the $39,950 franchise fee and significant equipment needs. This total includes $180,000 for leasehold improvements and $210,000 for specialized printing and embroidery machinery.
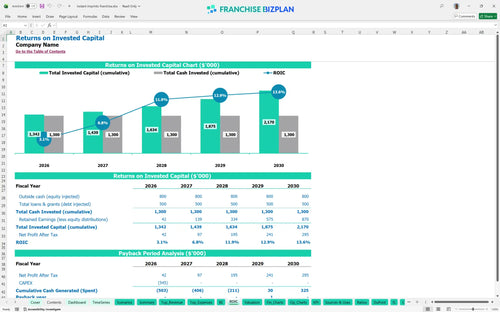
Investors can expect a 4-year payback period on the initial investment. The model shows an Internal Rate of Return (IRR) of 3.13% and a Return on Equity (ROE) of 1.09 based on the 5-year growth trajectory.
The monthly break-even is achieved in the first month of operation, January 2026. The most critical driver for this is maintaining a high average ticket on custom apparel and signage to cover the $12,650 in total monthly fixed expenses.
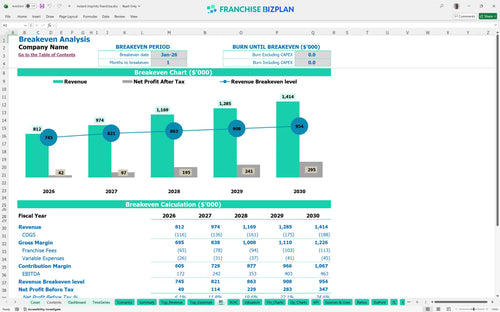
The lowest cash point occurs in April 2026 at $754,000, assuming you start with a robust capital reserve. You need enough runway to cover the initial inventory supplies and the ramp-up of the production crew as volume increases.
A High scenario accelerates your move from $812,000 to $1.4M in revenue, significantly improving your 4-year payback. The Low scenario would tighten margins quickly, as fixed costs like the $65,000 manager salary do not change with lower volume.
Finance: update unit break-even and payback model by Friday
This franchise unit financial model is a flexible Excel tool designed for high-precision planning. You can adjust every pre-filled formula and assumption to match your specific territory, local rent prices, and staffing needs, making it easy to simulate different business scenarios before you sign a lease.

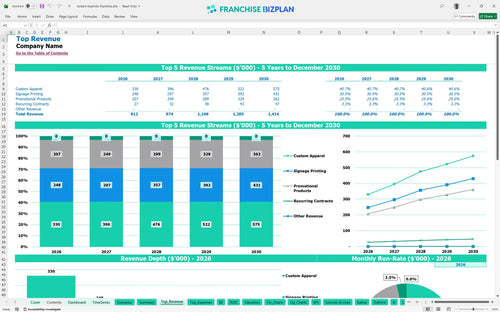
Plan for long-term growth with a detailed 5-year outlook that tracks your journey from a $812,000 Year 1 revenue to a projected $1,414,000 by Year 5. This pro forma (financial forecast) provides a clear view of how scaling your production and recurring contracts impacts your bottom line over time.

The model specifically handles the unique financial obligations of a franchise, including the $39,950 initial fee and ongoing 6% royalty payments. By automating these calculations against your gross sales, you can see exactly how brand fund contributions and royalties affect your monthly store-level margin.

Calculate your total initial investment by totaling build-out, equipment, and pre-opening costs to determine your exact capital requirements. The model identifies the specific sales volume needed to cover your $6,500 monthly rent and other fixed costs, helping you target the right opening-day traffic.

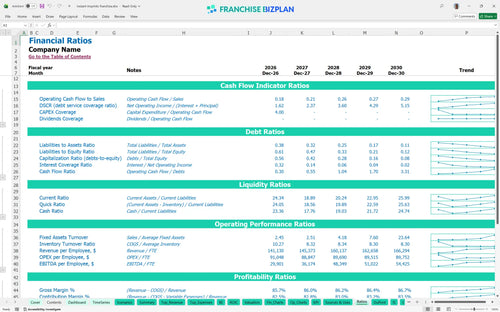
Use pre-loaded industry data to verify if your 12.5% material costs and labor allocations align with standard retail franchise performance. These benchmarks act as a reality check for your projections, ensuring your unit economics stay within a competitive and sustainable range for the custom apparel and signage sector.


Simply purchase and download the financial model template, then access it instantly using Microsoft Excel or Google Sheets. No installation or technical expertise required-just open and start working.

Enter your business-specific numbers, including revenue projections, costs, and investment details. The pre-built formulas will automatically calculate financial insights, saving you time and effort.

Leverage the investor-ready format to confidently showcase your financial projections to banks, franchise representatives, or investors. Impress stakeholders with clear, data-driven insights and professional reports.

Leverage the investor-ready format to confidently present your projections to banks, franchise representatives, or investors.