
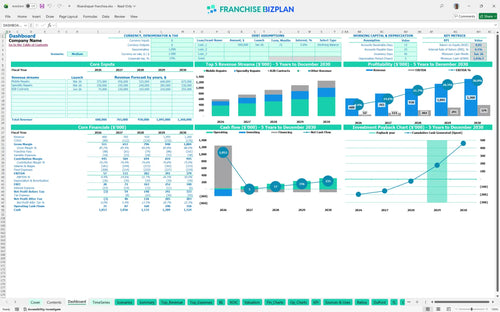
All-in-one Dashboard
Core inputs and core outputs


The franchise financial model template provides a complete roadmap for unit economics analysis and projecting operating costs for tech service centers.
Core inputs and core outputs
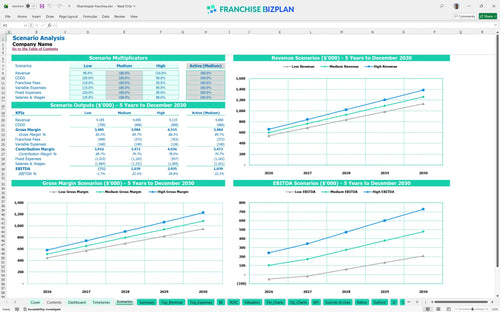
Three scenario analysis
Presentation ready
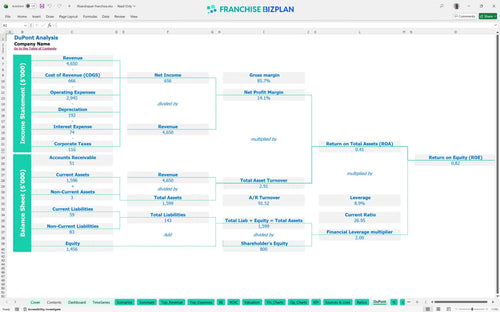
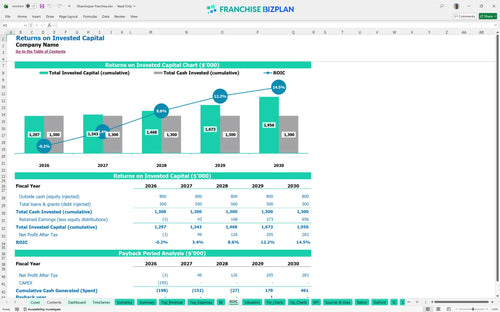
DuPont analysis
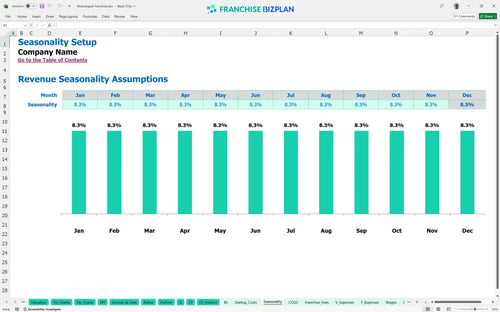
Researched revenue assumptions
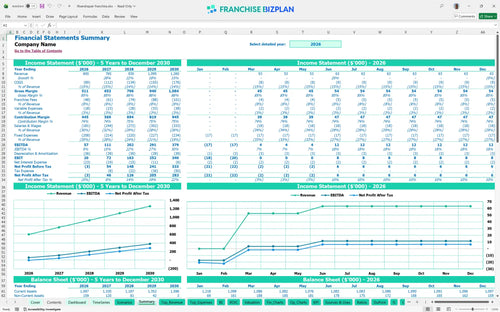
Lender-friendly financial outputs
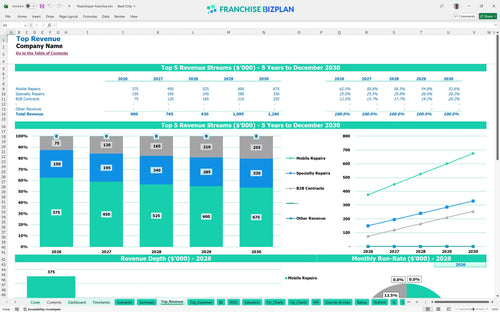
Revenue stream detailed view
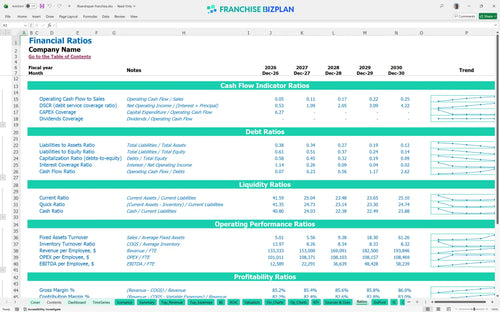
Performance metrics benchmark
We built this franchise unit financial model using deep-dive research into the electronics repair sector. Key assumptions like the $600,000 year-one revenue and the 8% combined royalty and marketing fee are pre-populated but fully editable to match your specific territory. This tool helps you move from guessing to data-driven decision making. Numbers tell the story your gut can't.
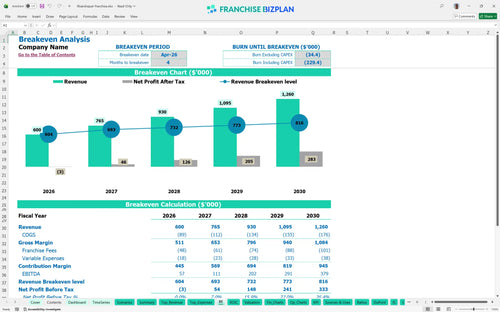
The unit reaches monthly break-even by April 2026, just four months after launching. By year three, the model projects an EBITDA of $202,000 as you scale B2B contracts and specialty repairs. Profit follows discipline.
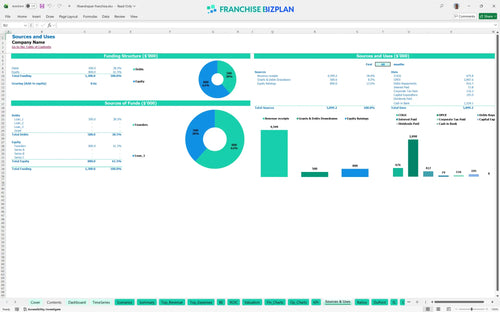
You will need approximately $195,000 for the initial build-out and fees, plus a significant cash buffer. The total investment covers the $25,000 franchise fee and $80,000 in leasehold improvements for a prime retail location. Know where every dollar goes.
Investors can expect an IRR of 4.12% and a full payback on the initial investment within 4 years. While the ROE sits at 0.82, the steady climb in annual revenue suggests long-term equity growth as the location matures. Essential financial metrics for franchise owners are baked into the dashboard. Time is the most expensive cost.
Reaching the break-even point in April 2026 depends heavily on hitting the $250,000 mobile repair target. Rent is the largest fixed burden at $12,000 monthly, so throughput and average ticket size are the primary levers for survival. Volume solves many problems, but not all.
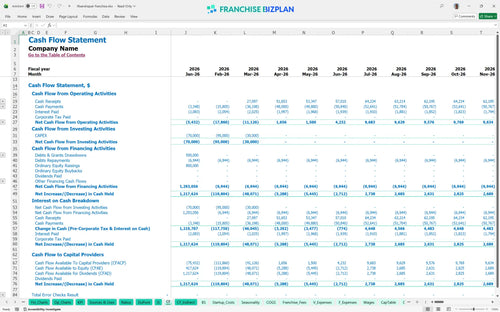
The lowest cash point occurs in June 2026, requiring a minimum cash reserve of $1,036,000 to handle the ramp-up. This model suggests keeping a tight lid on variable costs during the first six months to protect the runway. Runway is your life support.
Estimating profitability for electronics repair shops requires looking at low and high cases. A 10% dip in revenue defintely pushes the payback period past year five, while a high-performance scenario could see EBITDA exceed $400,000 by year five. Hope is not a strategy.
This electronics repair franchise business plan lives in a flexible Excel environment where every variable is adjustable. You can tweak the $12,000 monthly rent or the 13% parts cost to see how they impact your bottom line in real-time. This franchise financial forecasting spreadsheet for beginners makes it easy to adapt to a specific location and operating scenario. Every 1-point margin leak matters in this model.

Mapping out a retail franchise financial projection requires looking past the first year of operations. With revenue scaling from $600,000 in year one to $1,260,000 by year five, this model tracks how margins expand as you optimize labor and parts procurement. This financial model template for retail franchise locations provides a clear franchise P&L statement for five years. Revenue is vanity, profit is sanity.

Managing franchise royalty and supply chain costs is critical for maintaining store-level margins. This model accounts for the 6% royalty and 2% marketing fee, ensuring you see exactly how much cash stays in the unit after the franchisor takes their cut. It captures all ongoing financial obligations so you can understand the real economics of the business. Royalties are a top-line tax that never sleeps.

Use the franchise startup cost calculator to estimate the total capital needed before the doors open. By analyzing the $195,000 in initial capital expenditure forecasting against a four-month break-even target, you can plan your working capital needs with precision. Knowing how to calculate startup costs for a repair franchise helps you avoid mid-ramp liquidity traps. Cash is more important than your mother.

This small business franchise investment analysis uses researched benchmarks to validate your projections. Comparing your $17,300 monthly fixed costs against industry standards helps ensure your tech shop remains competitive in a high-traffic retail environment. This franchise investment feasibility study template allows you to sanity-check your assumptions against typical performance ranges. Benchmarks keep your ego in check.


Simply purchase and download the financial model template, then access it instantly using Microsoft Excel or Google Sheets. No installation or technical expertise required-just open and start working.

Enter your business-specific numbers, including revenue projections, costs, and investment details. The pre-built formulas will automatically calculate financial insights, saving you time and effort.

Leverage the investor-ready format to confidently showcase your financial projections to banks, franchise representatives, or investors. Impress stakeholders with clear, data-driven insights and professional reports.

Leverage the investor-ready format to confidently present your projections to banks, franchise representatives, or investors.