
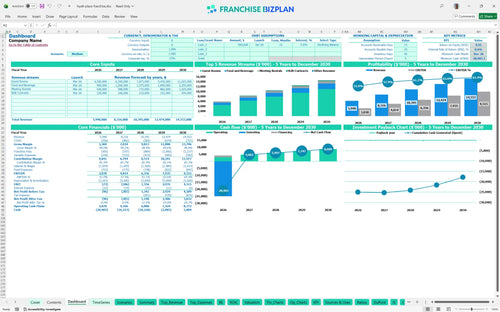
All-in-one Dashboard
Core inputs and core outputs


This franchise unit business plan template provides a complete framework for managing select-service hotel operations, from initial build-out to five-year profitability.
Core inputs and core outputs
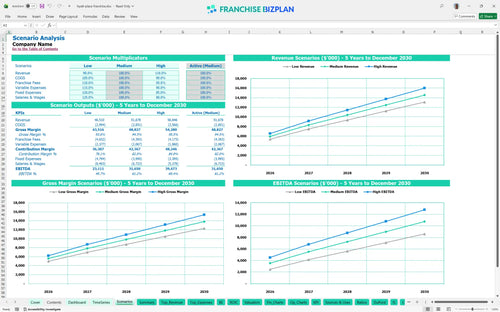
Three scenario analysis
Presentation ready
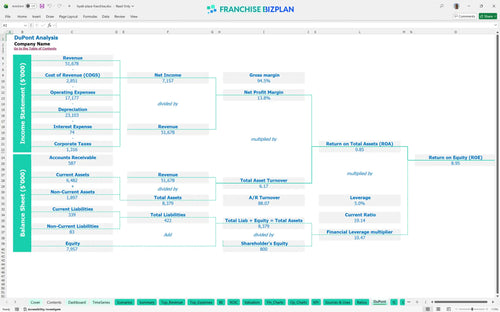
DuPont analysis
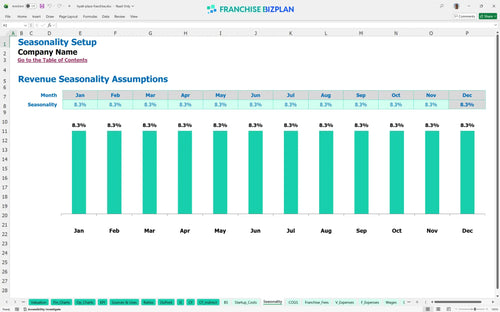
Researched revenue assumptions
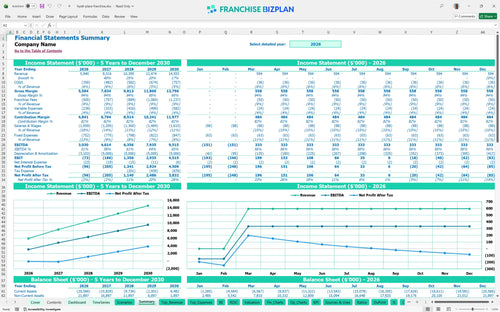
Lender-friendly financial outputs
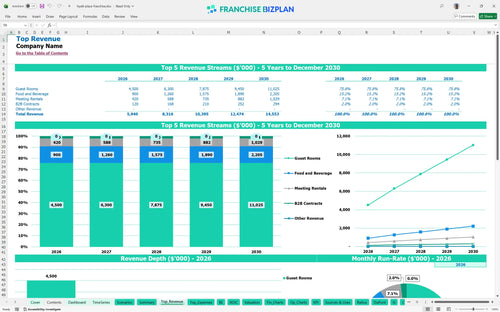
Revenue stream detailed view
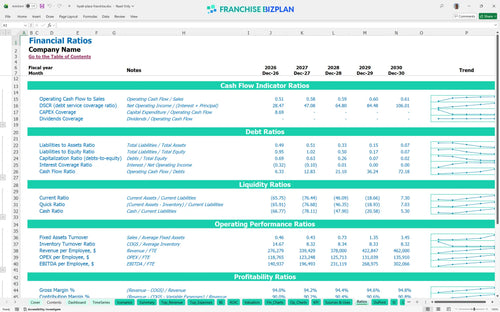
Performance metrics benchmark
We built this hotel investment feasibility study using detailed market research to help you evaluate the unit economics of this specific brand. Key assumptions, including the $5,940,000 year-one revenue and $3,030,000 EBITDA (earnings before interest, taxes, depreciation, and amortization), are pre-populated and fully editable to reflect your local market conditions.
The unit reaches its break-even point in March 2026, just three months after the launch date. This hotel franchise unit economics guide shows that while operational profitability is fast, the high initial investment means you are managing for long-term cash flow. A franchise profitability analysis confirms EBITDA grows from $3,030,000 in year one to $9,515,000 by year five.
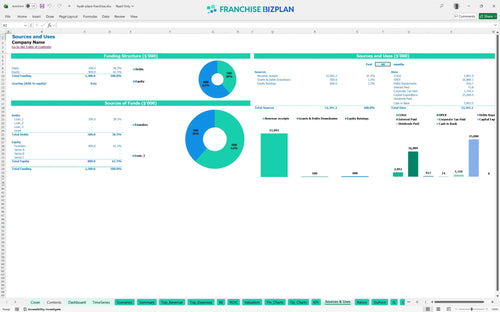
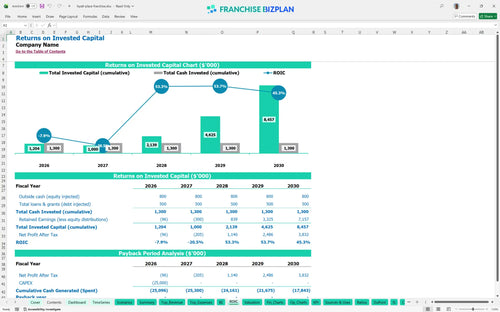
Launching this unit requires approximately $25,000,000 in total capital, which is a significant hotel capital expenditure planning (CAPEX) undertaking. This investment covers the $75,000 franchise fee, $12,000,000 in leasehold improvements, and $3,500,000 for guest room furniture and fixtures (FF&E). You also need a $3,625,000 contingency fund to handle unexpected pre-opening costs.
When assessing ROI for hotel franchise opportunities, this model projects an Internal Rate of Return (IRR) of 0.6% and a Return on Equity (ROE) of 8.95%. Because the initial cash outlay is so high, the full payback period extends beyond the first five years of operation. Still, the steady climb in net margin makes it a stable long-term play for institutional investors.
The monthly break-even point is reached in March 2026, driven primarily by guest room bookings. Estimating revenue from hotel meeting space rentals also plays a role, contributing $280,000 in the first year. To reach this point faster, you must manage the 8.5% combined royalty and marketing fee burden against your fixed monthly rent of $35,000.
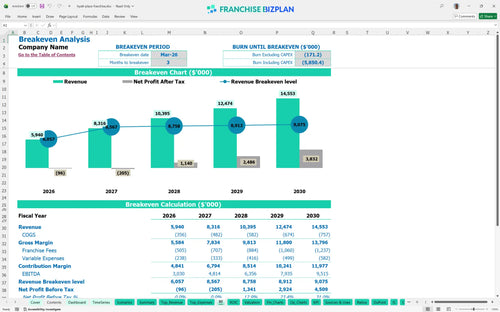
The lowest cash point occurs in December 2026, with a minimum cash balance of -$20,905,000. This reflects the intense capital outlay for construction and FF&E before the unit reaches full occupancy. You will need about 12 months of runway from the start of construction to reach a self-sustaining cash flow position.
Analyzing profitability for corporate business hotel franchises requires looking at Low, Medium, and High scenarios. If you hit the high-case scenario, your EBITDA could defintely exceed the $3,030,000 year-one baseline by leveraging fixed costs against higher room rates. Conversely, a low-case scenario might delay your March 2026 break-even date by several months.
This hotel franchise financial model is an Excel-based tool designed for evaluating a select-service hotel investment. You can edit every formula and assumption to match your specific territory, making it a versatile franchise business plan financial forecast example for single units or multi-unit portfolios.

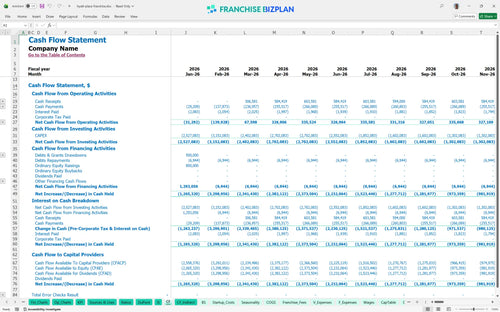
Long-term planning is essential for hospitality industry financial projections, and this model provides a detailed 5-year view of your income statement and cash flow. It functions as a commercial real estate investment analysis tool, allowing you to map out financial projections for select-service hotel investment from opening day through stabilization.

The model simplifies budgeting for hotel franchise royalty and marketing fees by automating the calculations based on your gross room revenue. It captures the full franchise royalty fee structure, including the 5% royalty and 3.5% marketing fund contributions, so you can see the impact on your store-level margin.

Understanding how to calculate startup costs for a hotel franchise is critical when the initial investment exceeds $25 million. This hotel franchise operating expenses spreadsheet helps you identify the exact sales volume needed to cover your fixed property rent of $35,000 and variable costs like booking commissions.

This model includes built-in benchmarks to help you sanity-check your revenue per available room forecasting (RevPAR) and labor costs. By comparing your projected performance against industry standards, you can ensure your guest room and food and beverage assumptions stay within realistic operating ranges.


Simply purchase and download the financial model template, then access it instantly using Microsoft Excel or Google Sheets. No installation or technical expertise required-just open and start working.

Enter your business-specific numbers, including revenue projections, costs, and investment details. The pre-built formulas will automatically calculate financial insights, saving you time and effort.

Leverage the investor-ready format to confidently showcase your financial projections to banks, franchise representatives, or investors. Impress stakeholders with clear, data-driven insights and professional reports.

Leverage the investor-ready format to confidently present your projections to banks, franchise representatives, or investors.