
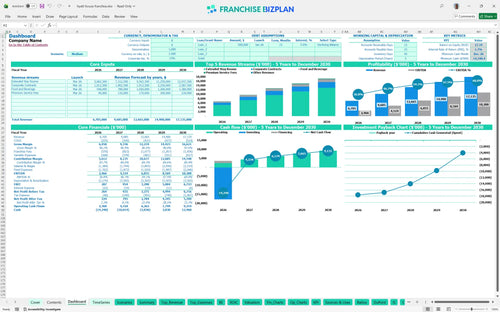
All-in-one Dashboard
Core inputs and core outputs


This franchise unit financial model template provides a professional-grade pro forma statement and cash flow tracker designed specifically for extended-stay hospitality operations.
Core inputs and core outputs
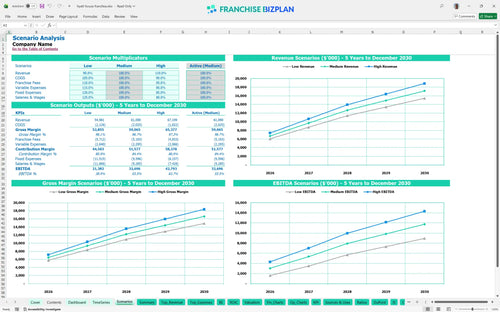
Three scenario analysis
Presentation ready
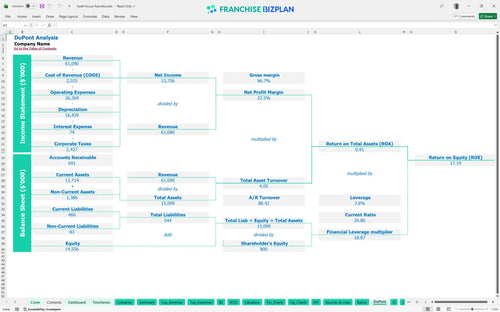
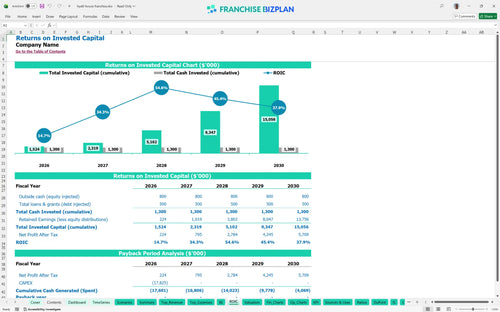
DuPont analysis
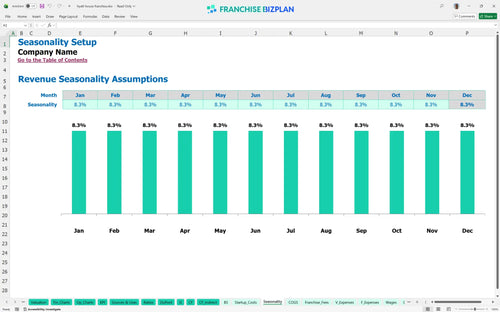
Researched revenue assumptions
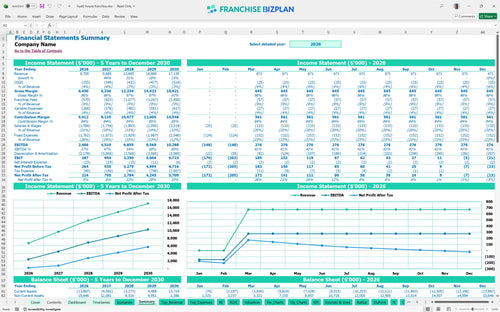
Lender-friendly financial outputs
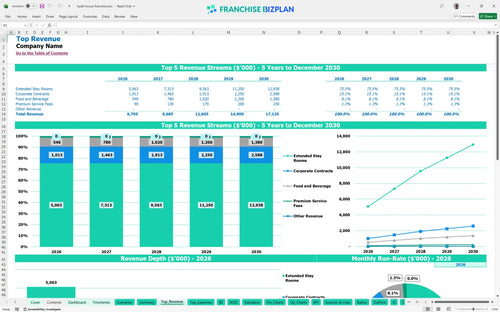
Revenue stream detailed view
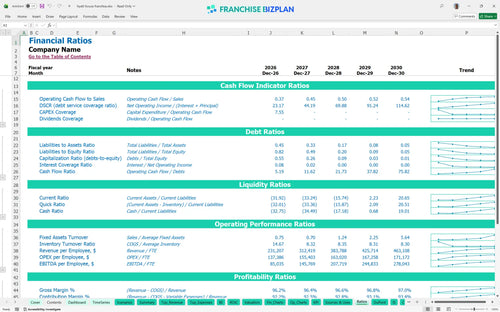
Performance metrics benchmark
We built this franchise unit financial model using our own research into the extended-stay hospitality sector. Key assumptions, including the $17.1 million year-five revenue target and the 8.5% total royalty and marketing burden, are pre-populated and fully editable. This tool helps you navigate the complex unit economics of a high-CAPEX hotel investment with confidence.
You can expect to see positive EBITDA immediately, but true net profitability depends on clearing your high debt service or initial capital outlay. Based on the data, the unit hits its stride in year three with $6.8 million in EBITDA as revenue per available room (RevPAR) stabilizes. Profitability is defintely a marathon here, not a sprint.
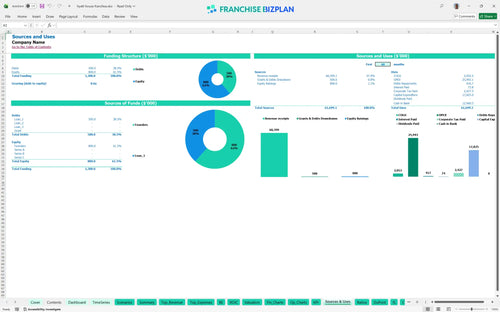
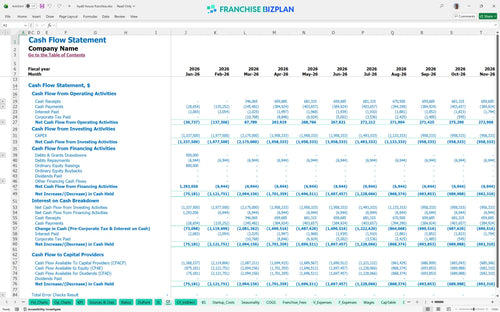
Launching this unit in the US requires a massive initial investment of approximately $17.8 million. This includes the $75,000 franchise fee and over $15 million in combined leasehold improvements and FF&E (Furniture, Fixtures, and Equipment). You'll also need a significant cash buffer to handle the $14.2 million minimum cash dip during the heavy construction and ramp-up phase.
The internal rate of return (IRR) is projected at 1.75%, with a return on equity (ROE) of 17.19. While the payback period extends beyond the five-year mark, the asset value and steady cash flow in later years provide the real exit value. This is a long-term play for wealth preservation rather than a quick flip.
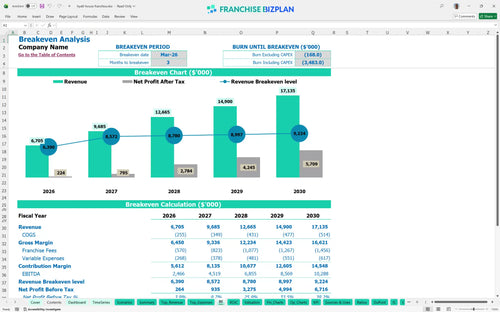
The unit reaches its monthly break-even point in March 2026, just three months after the initial launch phase. The biggest driver for this is your room occupancy; if you don't hit your extended-stay room targets, the $100,000 monthly rent and $160,000 GM salary will eat your cash fast. Still, the high average ticket of extended stays helps you get there quickly once doors open.
Your lowest cash point occurs in December 2026, with a projected deficit of $14.2 million due to the heavy front-loaded construction costs. You need a robust franchise unit cash flow projection template to manage this gap. We recommend having a 10% contingency fund-about $1 million-to handle any delays in the build-out or permitting process.
A hotel franchise profitability analysis template must account for market shifts. In a 'High' scenario, increasing your corporate contract revenue by 10% can drastically pull forward your payback date and improve your year-1 margin. Conversely, a 'Low' scenario where OTA commissions stay high and occupancy lags would require more working capital to survive the second year.
This hotel franchise financial model allows you to swap out every assumption, from room rates to local labor taxes. Since every market has different utility costs and property taxes, the pre-filled formulas ensure your math stays clean while you tweak the variables. Honestly, a model is only as good as its inputs, so we made every cell editable for your specific territory.

Mapping out a five-year horizon is critical for a hospitality business financial projection. You need to see how revenue scales from $6.7 million in year one to over $17.1 million by year five as the property stabilizes and gains local market share. This view helps you plan for future capital needs and understand when the unit truly starts throwing off significant cash for multi-unit expansion.

Managing the franchise royalty fee structure is a non-negotiable part of your monthly cash flow. With a 5% royalty and a 3.5% marketing fee, you are looking at 8.5% of gross revenue off the top before you even pay for guest amenities or labor. Our model tracks these obligations precisely so you never miss a payment or a margin target while maintaining brand standards.

Your hotel startup cost calculator needs to account for massive upfront items like $10.5 million in leasehold improvements and $3.2 million in furniture and fixtures. Knowing your break-even sales estimates helps you sleep at night during those first few months of operation. Here's the quick math: with high fixed costs, hitting your occupancy targets early is the only way to cover that $100,000 monthly rent.

The model incorporates built-in franchise and industry benchmarks for key operating and financial metrics to help you sanity-check your projections. We use hospitality industry benchmarking to ensure your guest amenities and linen costs-currently projected at 2%-don't spiral out of control. Comparing your projected startup costs for a boutique hotel franchise against these standards prevents 'optimism bias' during the planning phase.


Simply purchase and download the financial model template, then access it instantly using Microsoft Excel or Google Sheets. No installation or technical expertise required-just open and start working.

Enter your business-specific numbers, including revenue projections, costs, and investment details. The pre-built formulas will automatically calculate financial insights, saving you time and effort.

Leverage the investor-ready format to confidently showcase your financial projections to banks, franchise representatives, or investors. Impress stakeholders with clear, data-driven insights and professional reports.

Leverage the investor-ready format to confidently present your projections to banks, franchise representatives, or investors.