
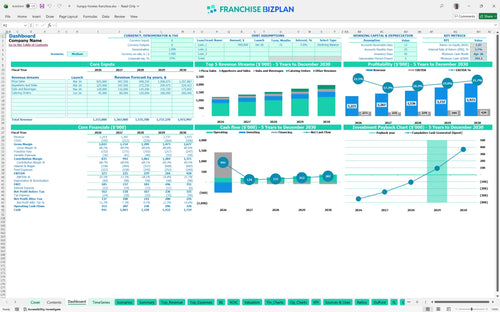
All-in-one Dashboard
Core inputs and core outputs


This comprehensive franchise unit financial model provides a detailed roadmap for store-level performance, from initial build-out to five-year cash flow maturity.
Core inputs and core outputs
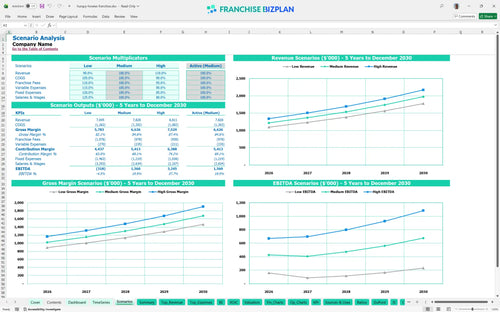
Three scenario analysis
Presentation ready
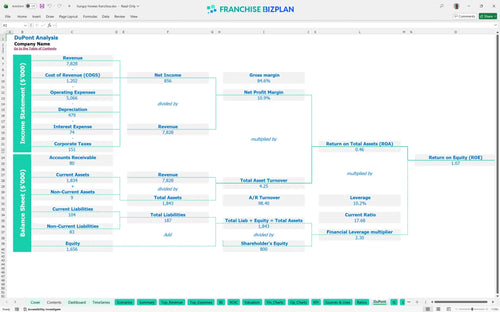
DuPont analysis
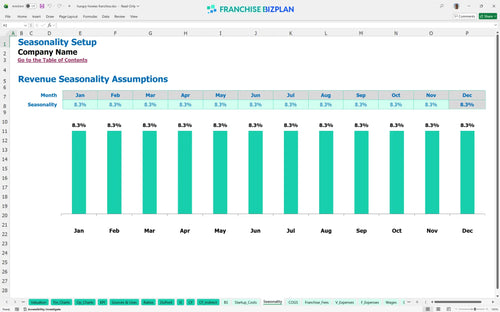
Researched revenue assumptions
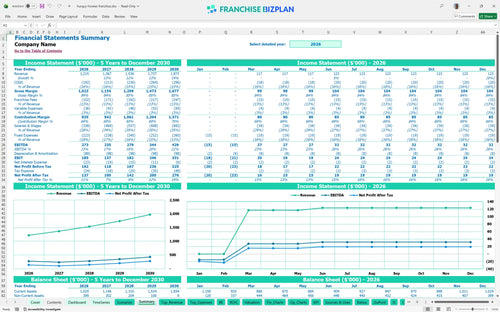
Lender-friendly financial outputs
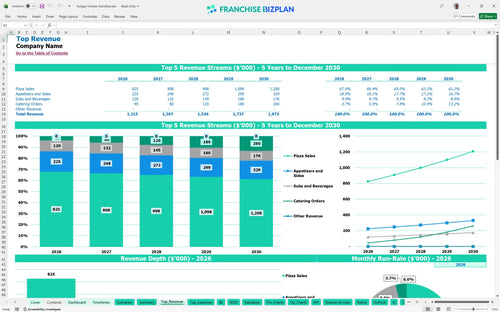
Revenue stream detailed view
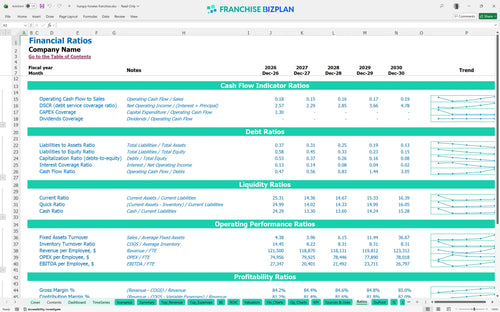
Performance metrics benchmark
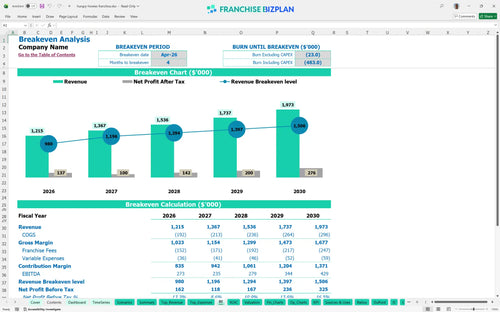
We built this pizza franchise financial model using detailed market research to ensure your projections are grounded in reality. Key assumptions like the 5.5% royalty fee and the $210,000 leasehold improvement cost are pre-populated and fully editable to match your specific territory. With a projected Year 1 revenue of $1,215,000 and a 4-month window to break-even, this tool helps you navigate the complex unit economics of the pizza industry.
Based on the researched data, this unit becomes profitable in April 2026, which is just four months after the doors open. This pizza franchise unit profitability forecast accounts for the ramp-up of catering orders and high-volume delivery sales starting in the first half of the year.
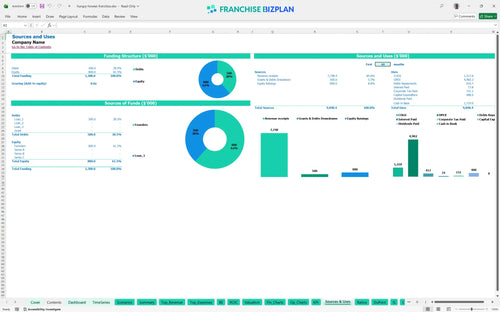
To launch this unit in the US, you need a total initial investment of $488,000, which includes the $25,000 franchise fee and all necessary equipment. This startup budget for a quick service restaurant covers your primary build-out and the essential cash buffer needed for the first few months of operations. Knowing how to calculate startup costs for a pizza franchise correctly prevents mid-construction funding gaps.
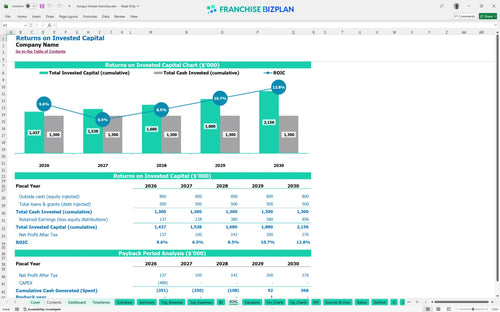
Our ROI analysis shows an Internal Rate of Return (IRR) of 3.73% and a Return on Equity (ROE) of 1.07. The payback period is estimated at 4 years, which is a standard timeline for a high-traffic retail location with significant leasehold improvements and specialized kitchen infrastructure.
The monthly break-even point is reached in April 2026, driven primarily by the high fixed cost of the $13,500 prime location rent. You defintely need to maintain a high average ticket and efficient labor scheduling to cover the combined 12.5% royalty and marketing burden. This pizza shop unit economics template helps you visualize the breakdown of pizza franchise operating expenses so you can manage your margins daily.
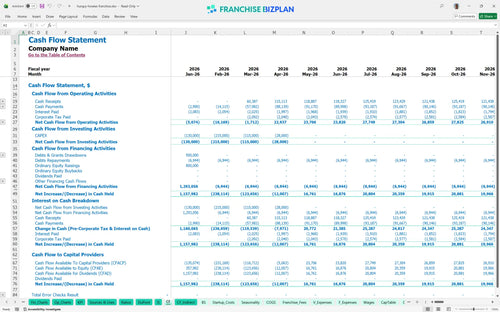
The lowest cash point for the unit is $784,000 in April 2026, which includes the initial funding and the operational ramp-up period. When you project cash flow for a franchise location, having a clear view of this 'lowest point' ensures you don't run out of capital before the catering revenue kicks in. Cash is king during the first 120 days of operation.
This franchise profitability analysis allows you to compare Low, Medium, and High scenarios to see how a 10% shift in pizza sales impacts your year-1 EBITDA of $273,000. Learning how to evaluate a pizza franchise opportunity requires testing these sensitivities to see how peak cash needs change if your labor costs or food ingredients spike unexpectedly.
Finance: update unit break-even and payback model by Friday using this financial planning guide for new franchise owners.
This pizza franchise financial model is built entirely in Excel, giving you total control over every assumption. You can easily adjust the pre-filled formulas for local labor rates, specific rent costs, and your territory's expected traffic to see how they impact your bottom line. It is a flexible restaurant financial projection spreadsheet designed for both single-unit operators and multi-unit developers who need to stress-test their numbers.

Planning for the long term is essential when you are looking at a multi-year lease and equipment financing. This franchise unit business plan template provides a detailed 5-year outlook, showing revenue growing from $1.21 million in year one to over $1.97 million by year five. You get a clear view of how scaling your catering and delivery channels will shift your margin profile over time.

The model handles the specific financial obligations found in a typical franchise disclosure document, such as the 5.5% royalty and 7% marketing fund contribution. By automating these calculations, you can see the exact dollar amount leaving the business before you cover your local fixed costs. This is the most accurate way of estimating recurring costs for a food franchise while maintaining store-level visibility.

Nailing your pizza shop startup costs is the first step toward a successful launch. This restaurant franchise financial model Excel template breaks down the $488,000 initial investment, covering everything from the $210,000 leasehold improvements to the $110,000 for high-capacity ovens. It calculates the exact sales volume you need to hit each month to cover your fixed overhead and start generating a profit.

We have integrated standard unit economics and EBITDA projections to help you compare your store's performance against industry averages. Whether you are looking at food costs starting at 14% or labor staffing for a high-volume kitchen, these benchmarks act as a sanity check for your business plan. Don't guess on your margins; use the built-in data to ensure your projections stay within a realistic range.


Simply purchase and download the financial model template, then access it instantly using Microsoft Excel or Google Sheets. No installation or technical expertise required-just open and start working.

Enter your business-specific numbers, including revenue projections, costs, and investment details. The pre-built formulas will automatically calculate financial insights, saving you time and effort.

Leverage the investor-ready format to confidently showcase your financial projections to banks, franchise representatives, or investors. Impress stakeholders with clear, data-driven insights and professional reports.

Leverage the investor-ready format to confidently present your projections to banks, franchise representatives, or investors.