


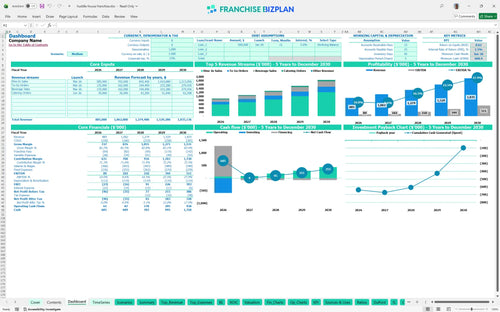
All-in-one Dashboard
Core inputs and core outputs



This franchise unit financial projection spreadsheet includes detailed revenue drivers, staffing models, capital expenditure schedules, and a full set of pro forma financial statements.
Core inputs and core outputs
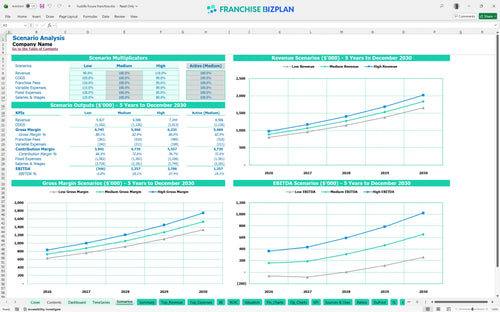
Three scenario analysis
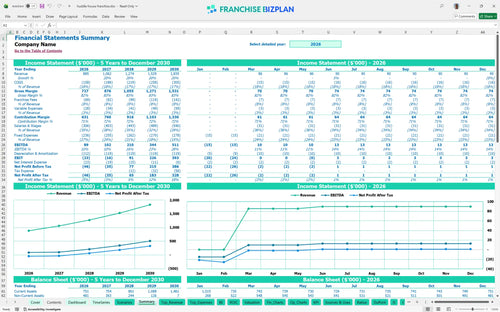
Presentation ready
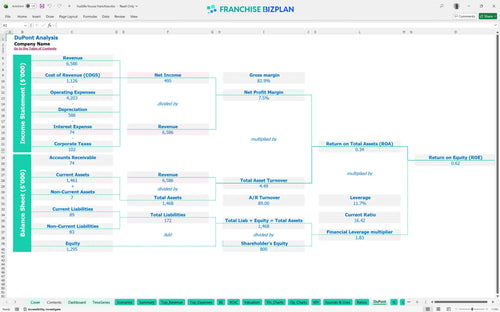
DuPont analysis
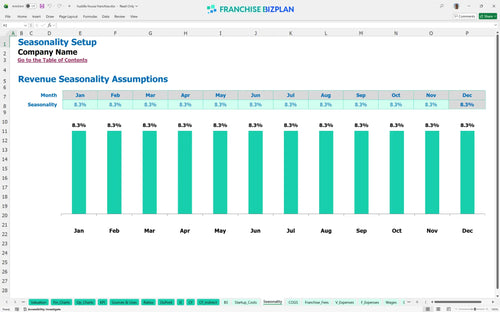
Researched revenue assumptions
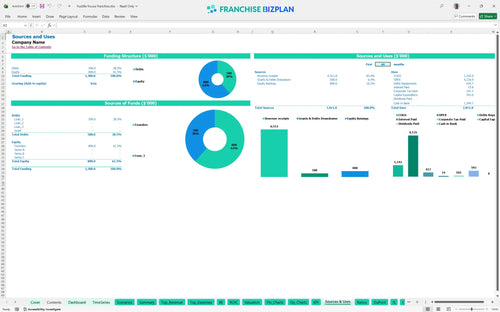
Lender-friendly financial outputs
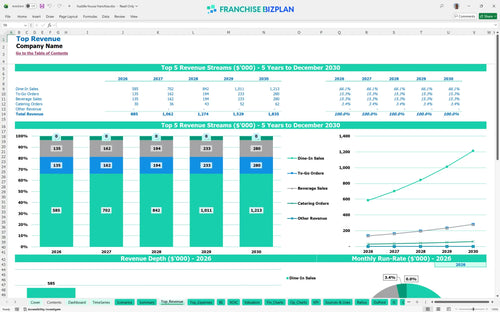
Revenue stream detailed view
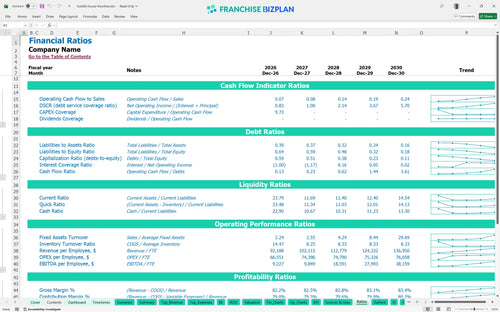
Performance metrics benchmark
We built this financial model for full service restaurant franchise using our own research to help you navigate the diner space. Key assumptions like the $35,000 franchise fee and 24/7 labor needs are pre-populated and fully editable. With Year 1 revenue starting at $885,000, this tool helps you see if the margins work for your specific location.
The unit reaches store-level EBITDA profitability in Year 1 with $89,000 in earnings. However, net profit after all operating expenses and debt service requires scaling revenue to $1.27M by Year 3. Here is the quick math: your food cost starts at 16% and needs to drop to 14.8% by Year 5 to hit your targets in this startup budget template for new restaurant franchise.
You need a significant initial investment, with total capital expenditure exceeding $600,000 for a standard build-out. This includes $280,000 for leasehold improvements and $120,000 for kitchen equipment, plus a $35,000 initial fee and a cash buffer for the first few months of operations.
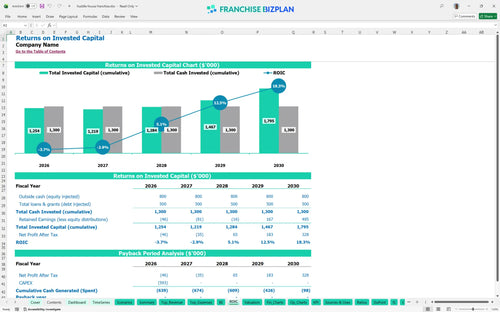
The ROI calculation shows an IRR of 1.52% and a return on equity of 0.62. While the unit generates cash quickly, the full payback of the initial investment occurs after Year 5 due to the high upfront costs. This is defintely a long-term play for multi-unit operators looking for stable cash flow.
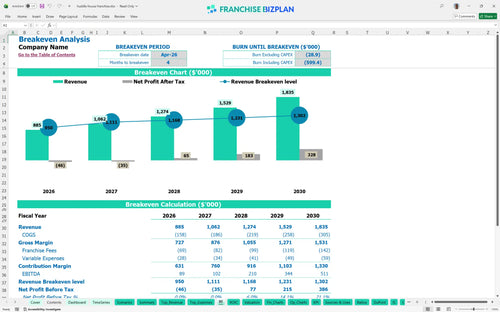
The restaurant franchise cash flow projection model shows a breakeven date of April 2026, just 4 months after launch. To cover the $13,000 monthly rent and $15,000+ in management salaries, you must maintain steady 24-hour traffic and a strong average ticket from the start.
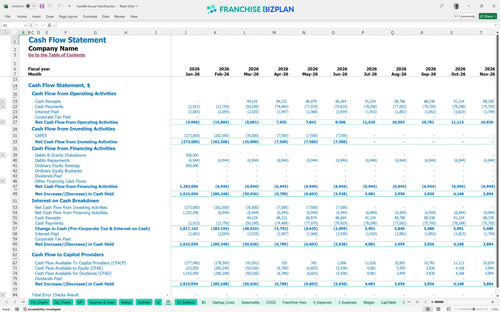
The lowest cash point occurs in June 2026 at $660,000 during the initial ramp-up phase. You need to maintain a deep cash buffer during the first six months to handle operating expenses like the $3,200 monthly utility bill and staffing before revenue peaks.
Analyzing franchise unit profitability and margins across scenarios shows that a 10% drop in revenue significantly delays payback. The high case, reaching $1.8M in sales by Year 5, dramatically improves the franchise profitability analysis and annual cash flow for the operator.
This is the best financial spreadsheet for restaurant owners looking for a franchise financial model that adapts to their specific market. You can easily modify the restaurant startup costs and local labor rates within the Excel-based tool to see how different operating scenarios impact your bottom line.

Long-term planning is essential for a 24 hour restaurant business model template where margins are won or lost in the overnight shifts. This tool provides a detailed 5-year outlook on revenue, store-level EBITDA, and cash flow to help you map out multi-unit growth or single-unit stability.

Knowing how to forecast franchise royalty and advertising fees is vital for protecting your store-level margin before you sign a franchise disclosure document. The model automatically calculates the 4.75% royalty and 3% marketing fund contributions based on your projected sales volume so there are no surprises.

Learning how to calculate franchise startup costs is the first step in this restaurant business plan template, covering everything from the $35,000 franchise fee to leasehold improvements. Use the franchise investment calculator to pinpoint the exact sales volume needed to cover your $13,000 monthly rent and other fixed obligations.

Estimating restaurant labor costs for franchises is easier with built-in unit economics benchmarks for kitchen and service staff. Comparing your 16% food cost assumption against industry standards helps you identify potential margin leaks in your pro forma before you break ground.


Simply purchase and download the financial model template, then access it instantly using Microsoft Excel or Google Sheets. No installation or technical expertise required-just open and start working.

Enter your business-specific numbers, including revenue projections, costs, and investment details. The pre-built formulas will automatically calculate financial insights, saving you time and effort.

Leverage the investor-ready format to confidently showcase your financial projections to banks, franchise representatives, or investors. Impress stakeholders with clear, data-driven insights and professional reports.

Leverage the investor-ready format to confidently present your projections to banks, franchise representatives, or investors.