
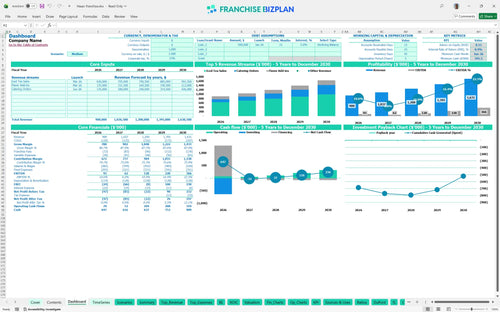
All-in-one Dashboard
Core inputs and core outputs


This franchise unit financial model template excel includes dynamic revenue drivers, detailed payroll calculators, and a full CAPEX (capital expenditures) schedule to map out your path to profitability.
Core inputs and core outputs
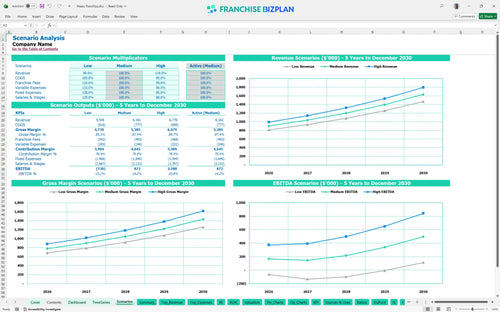
Three scenario analysis
Presentation ready
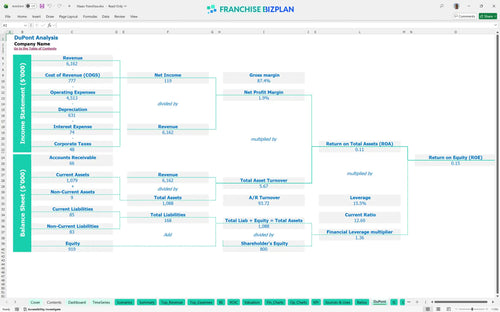
DuPont analysis
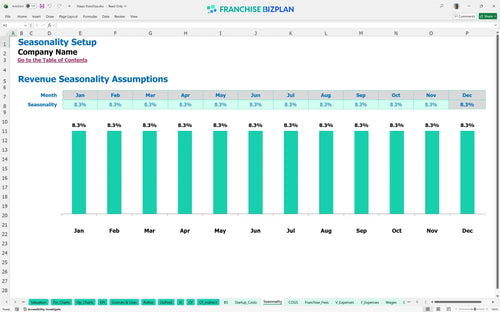
Researched revenue assumptions
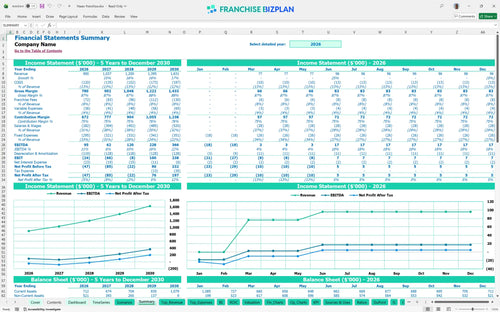
Lender-friendly financial outputs
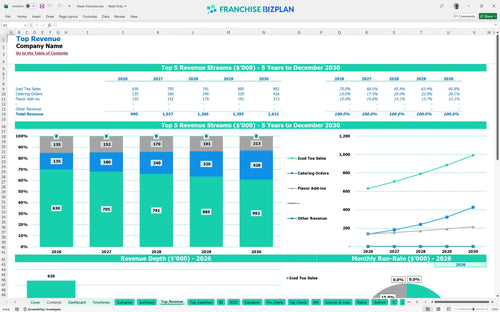
Revenue stream detailed view
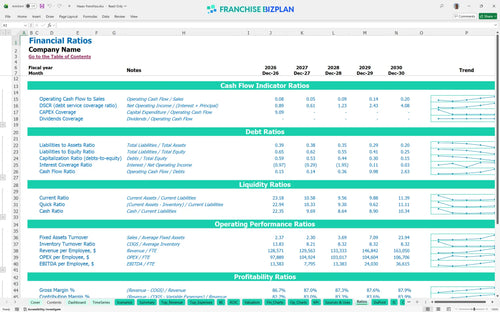
Performance metrics benchmark
We built this franchise unit financial model using our own research to help you navigate the unit economics of this beverage concept. Key assumptions like the $900,000 Year-1 revenue and 6% royalty fees are pre-populated and fully editable to match your specific location. This tool ensures your franchise profitability analysis is based on realistic targets, such as the 4-month break-even window seen in our data.
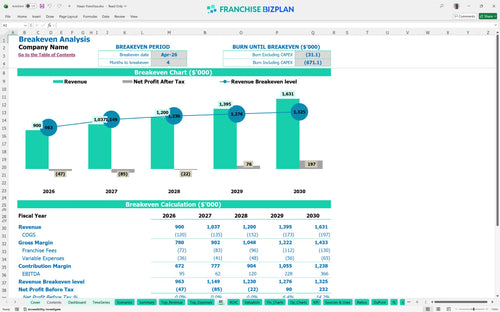
Based on the researched data, this unit hits its stride quickly, reaching monthly break-even by April 2026. While Year 1 shows an EBITDA (earnings before interest, taxes, depreciation, and amortization) of $95,000, true net profitability scales significantly by Year 5 as revenue climbs to $1.63M. You will need to manage the Year 2 dip where EBITDA settles at $62,000 before catering and loyalty programs fully kick in.
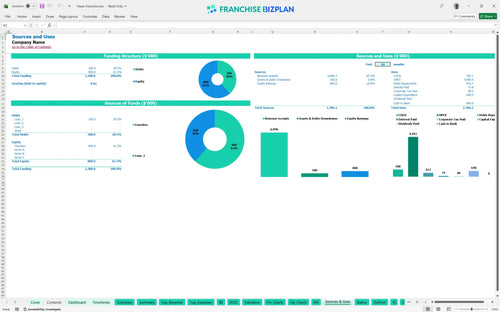
Launching this unit requires a significant upfront investment, with the model showing a minimum cash need of $595,000 by June 2026. This covers the $40,000 franchise fee, $300,000 in leasehold improvements, and $150,000 for specialized brewing and filtration equipment. You also need to budget for $25,000 in pre-opening expenses and a $20,000 initial inventory load to ensure a smooth grand opening.
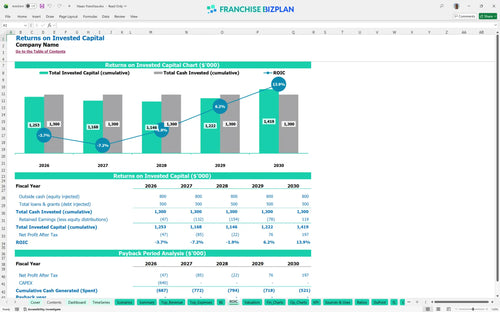
Investors can expect an Internal Rate of Return (IRR) of 39% and a Return on Equity (ROE) of 0.15. While the payback period extends beyond the 5-year mark due to the high initial build-out costs, the cash flow becomes very attractive by Year 5 with EBITDA hitting $366,000. This is a long-term play focused on high-volume throughput in a premium territory.
The unit reaches its break-even point in April 2026, roughly 4 months after the January start. To cover the $15,000 monthly rent and $25,000+ in monthly labor, you need to maintain high daily traffic and a strong average ticket. The 6% royalty and 2% marketing fee mean you need about 8% more volume than a non-franchised tea shop just to clear your fixed costs.
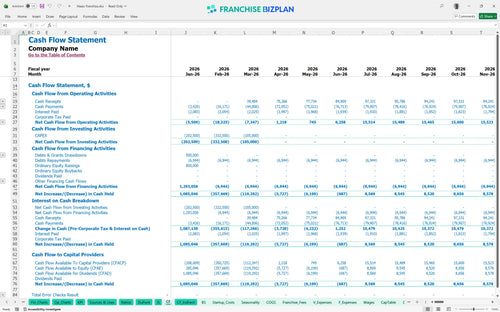
Your lowest cash point occurs in June 2026 at $595,000, which reflects the heavy CAPEX and initial ramp-up losses. You need enough working capital to survive the first six months before the $1.2M+ revenue years kick in. We recommend a 10% cash buffer above the minimum to handle any delays in the build-out or permitting.
Moving from a Medium to a High scenario-driven by better local marketing execution-can pull the payback period forward and significantly boost Year-1 margins. In a Low scenario, where revenue stays closer to the $900k mark, the $15,000 monthly rent becomes a much heavier burden on the store-level EBITDA. Financial forecasting for new franchise owners must account for these swings in labor and ingredient costs.
Finance: update unit break-even and payback model by Friday
This franchise unit financial model lives in Excel, giving you total control over the numbers. You can swap out pre-filled assumptions for your specific territory, whether you are looking at a high-traffic corner or a suburban strip. It is built with editable formulas so you can stress-test different rent scenarios or labor models without breaking the sheet.

Planning a beverage franchise investment requires a multi-year lens to see how margins evolve as the brand matures. This tool delivers a full 5-year outlook on revenue, costs, and cash flow to help you spot when the unit moves from ramp-up to steady-state profit. It includes a balance sheet view to track your equity and debt over time, ensuring your franchise profitability analysis is grounded in reality.

Royalties and brand funds are the tax you pay for a proven system, and they hit the top line every month. This model tracks the 6% royalty and 2% marketing fund contributions so you know exactly how much cash stays in your pocket after the franchisor gets paid. We have baked in the initial franchise fee and ongoing obligations to provide a clear picture of the real unit economics.

Knowing how to calculate startup costs for a beverage franchise is the first step toward avoiding a cash crunch. This section breaks down the total initial investment-from leasehold improvements to the reverse-osmosis filtration system-and calculates the exact sales volume needed to cover your monthly nut. A precise break-even analysis ensures you aren't guessing when the business will start paying for itself.

We include built-in benchmarks for labor, occupancy, and COGS (cost of goods sold) so you can see if your projections are aggressive or conservative. Comparing your store-level margin against quick-service restaurant standards helps you identify margin leaks before they become permanent problems. It is a sanity check for your franchise business plan template that keeps your numbers defintely realistic.


Simply purchase and download the financial model template, then access it instantly using Microsoft Excel or Google Sheets. No installation or technical expertise required-just open and start working.

Enter your business-specific numbers, including revenue projections, costs, and investment details. The pre-built formulas will automatically calculate financial insights, saving you time and effort.

Leverage the investor-ready format to confidently showcase your financial projections to banks, franchise representatives, or investors. Impress stakeholders with clear, data-driven insights and professional reports.

Leverage the investor-ready format to confidently present your projections to banks, franchise representatives, or investors.