
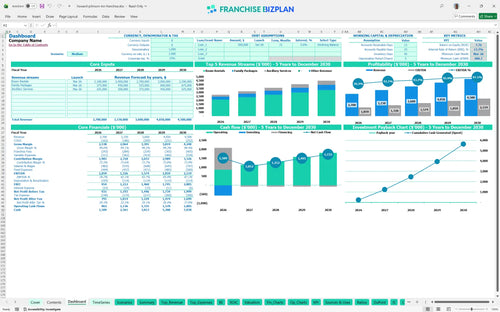
All-in-one Dashboard
Core inputs and core outputs


This financial model template for hospitality franchise provides a comprehensive Excel-based framework to project revenue, manage expenses, and analyze the total ROI of your hotel investment.
Core inputs and core outputs
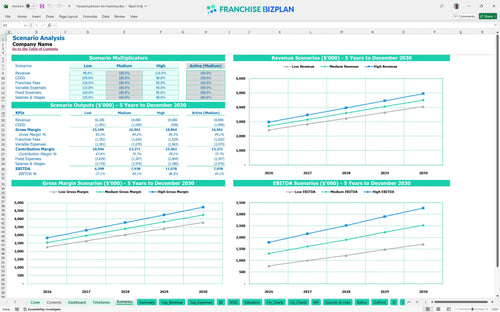
Three scenario analysis
Presentation ready
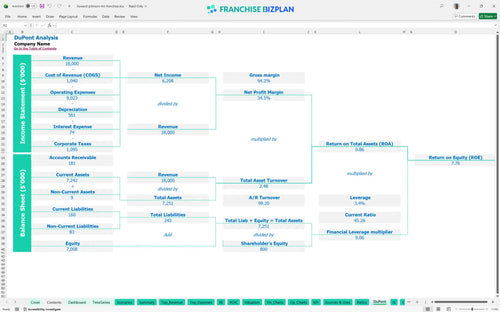
DuPont analysis
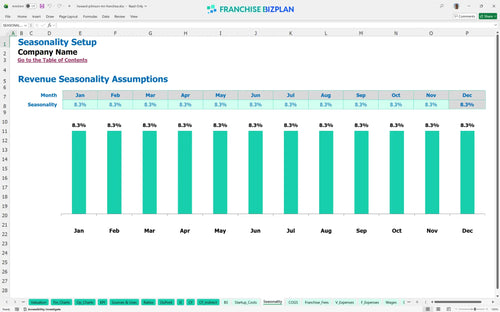
Researched revenue assumptions
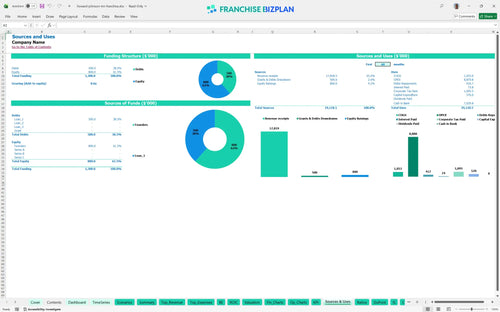
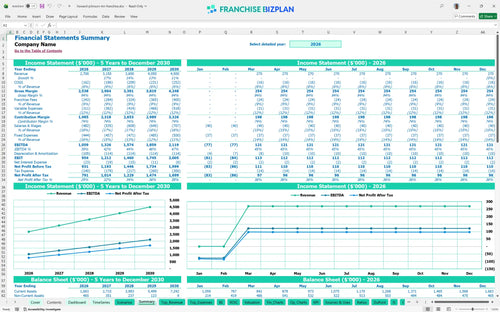
Lender-friendly financial outputs
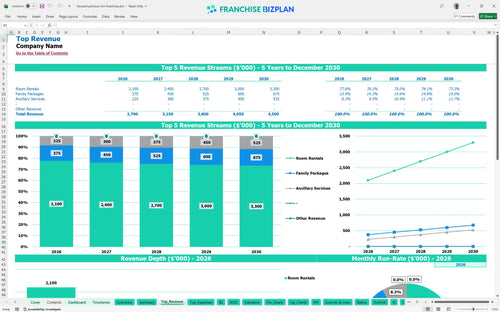
Revenue stream detailed view
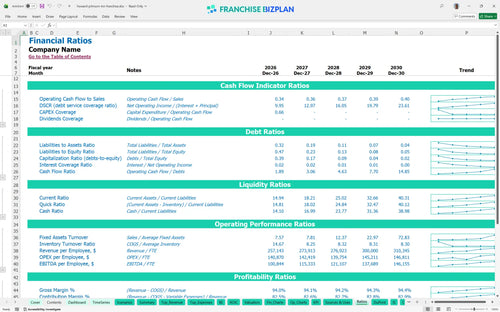
Performance metrics benchmark
We built this hotel franchise financial model using our own research to provide a realistic budget hotel franchise startup cost breakdown. Key assumptions like the $2.7M Year 1 revenue and 5% royalty fees are pre-populated and fully editable to help you analyze hotel franchise revenue streams and costs effectively.
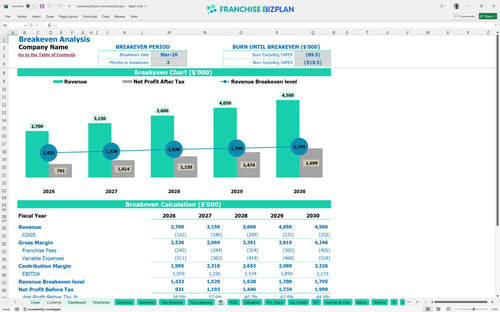
This unit reaches a break-even point in just 3 months, with Year 1 EBITDA hitting $1,059,000. By Year 5, revenue is projected to climb to $4,500,000 as you optimize room rentals and ancillary services while managing food costs that scale down to 3.1%.
You will need significant capital to launch, including $300,000 for leasehold improvements and $50,000 for smart room technology. The total initial investment covers the $35,000 franchise fee plus an opening cash buffer to handle the minimum cash low point of $687,000 in March 2026.
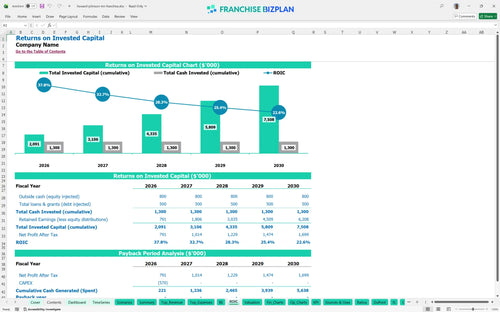
Investors can expect an Internal Rate of Return (IRR) of 13.66% and a Return on Equity (ROE) of 7.76% based on these franchise business plan financial assumptions. While the model shows a payback period extending after year 5, the steady climb in EBITDA to $2,119,000 by the fifth year demonstrates strong long-term equity building.
The monthly break-even point is reached in March 2026, roughly 3 months after the launch date. The primary driver for this is RevPAR forecasting, as you must cover over $37,000 in monthly fixed costs, including rent, utilities, and insurance, before generating a net profit.
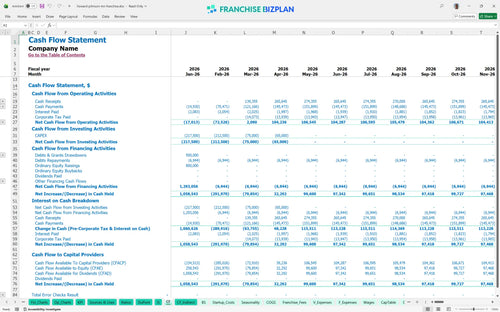
The lowest cash point occurs in March 2026 at $687,000, which coincides with your break-even month. You will need a solid working capital buffer to handle the ramp-up phase, especially since estimating operating expenses for a franchise hotel involves heavy upfront costs for signage and reservation systems.
A High scenario, driven by better-than-expected projecting occupancy rates for hotel franchises, can significantly pull forward the payback period. Conversely, a Low scenario with higher OTA commissions or lower room demand would defintely require more cash reserves to survive the first 12 months of operations.
This hotel franchise financial model is built in Excel with fully editable assumptions, allowing you to tweak every driver from room rates to staffing levels. You can adjust the pre-filled formulas to match your specific territory or local market conditions without needing a degree in finance to understand your hospitality business financial plan.

Map out your growth with a detailed 5-year outlook covering revenue, cash flow, and net profit for your franchise unit profitability projection. This view helps you see how scaling from Year 1 revenue of $2,700,000 to Year 5 revenue of $4,500,000 impacts your bottom line as the unit matures and gains market share.

The model tracks specific brand obligations like the 5.0% royalty fee and 4.0% marketing fee to ensure you understand the real economics of the franchise royalty fee calculation. By accounting for these ongoing costs alongside the initial $35,000 fee, you can build a more accurate hospitality operational budget.

Estimate your total hotel franchise startup costs, including $300,000 for leasehold improvements and $100,000 for furniture. This tool calculates the exact volume needed to cover fixed costs like the $25,000 monthly rent, providing a clear path to your 3-month break-even target.

We have integrated hotel management performance metrics to help you sanity-check your labor and occupancy costs against typical hospitality ranges. Comparing your projections to these benchmarks ensures your franchise financial feasibility study template remains realistic and defensible to potential lenders or partners.


Simply purchase and download the financial model template, then access it instantly using Microsoft Excel or Google Sheets. No installation or technical expertise required-just open and start working.

Enter your business-specific numbers, including revenue projections, costs, and investment details. The pre-built formulas will automatically calculate financial insights, saving you time and effort.

Leverage the investor-ready format to confidently showcase your financial projections to banks, franchise representatives, or investors. Impress stakeholders with clear, data-driven insights and professional reports.

Leverage the investor-ready format to confidently present your projections to banks, franchise representatives, or investors.