
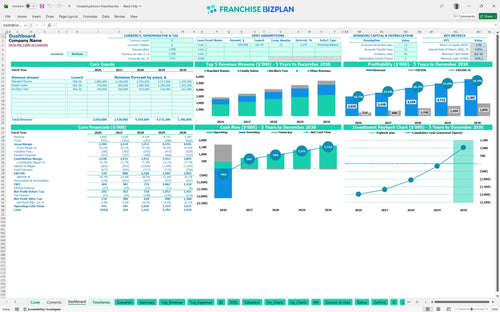
All-in-one Dashboard
Core inputs and core outputs


This hotel investment analysis tool provides a comprehensive Excel-based framework to forecast revenue, expenses, and investor returns for a hospitality property.
Core inputs and core outputs
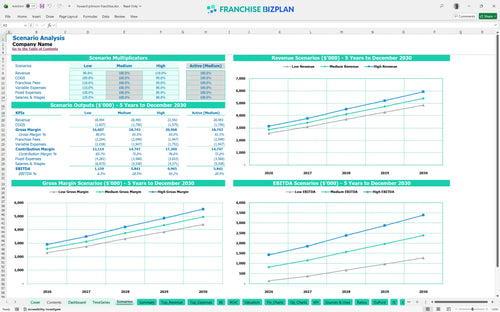
Three scenario analysis
Presentation ready
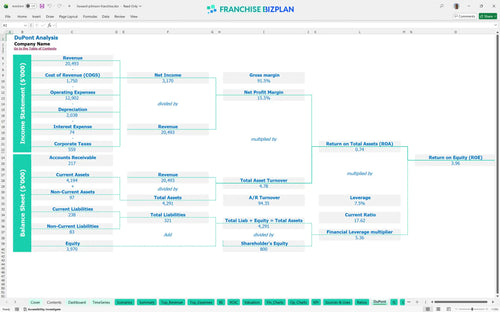
DuPont analysis
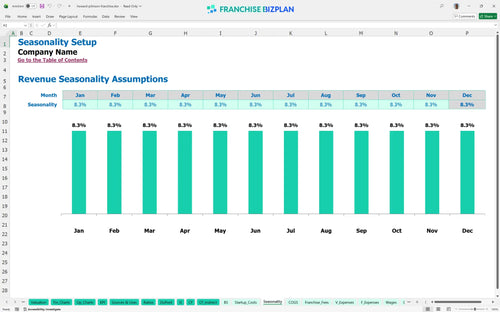
Researched revenue assumptions
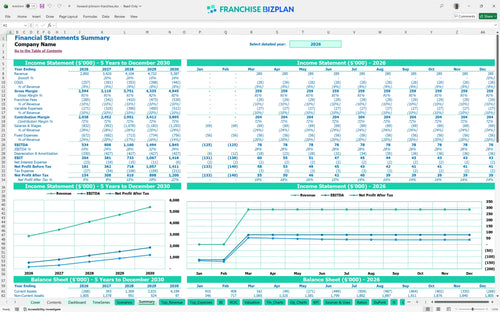
Lender-friendly financial outputs
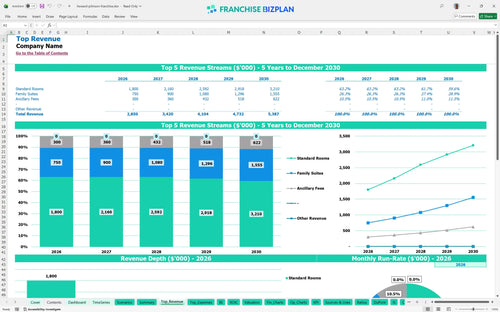
Revenue stream detailed view
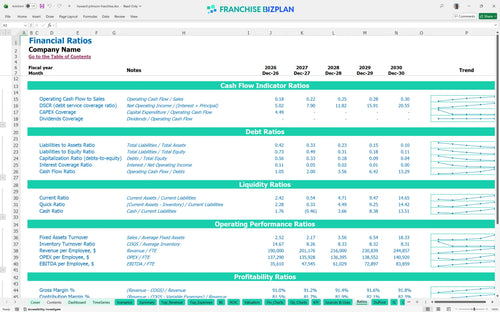
Performance metrics benchmark
We built this franchise unit financial model using extensive research into mid-scale hospitality economics and brand-specific requirements. Key assumptions, including the $2.85 million year-one revenue target and the $2.13 million initial capital stack, are pre-populated and fully editable to reflect your specific territory. This data-driven approach ensures your projections are rooted in real-world franchise performance metrics.
Estimating profitability for a new hotel franchise unit shows that this model reaches a positive EBITDA of $534,000 in its first year of operation. After accounting for housekeeping, laundry, and a 10% total brand fee, the unit becomes net profitable shortly after the April 2026 break-even date. Speed to profit is the only metric that keeps the lights on.
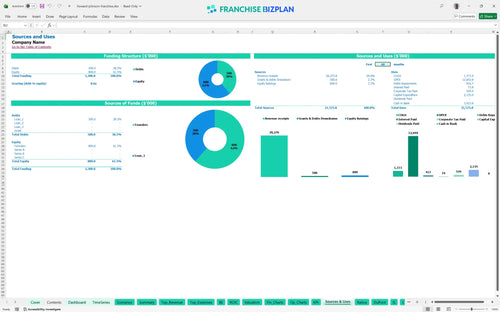
To launch this unit in the US, you need approximately $2,135,000 in total capital, which covers everything from the $35,000 brand fee to $800,000 in leasehold improvements. This hotel franchise investment feasibility study template allocates $400,000 for furniture and $300,000 for the pool oasis renovation to ensure brand compliance. Cash is king, but allocation is the kingdom.
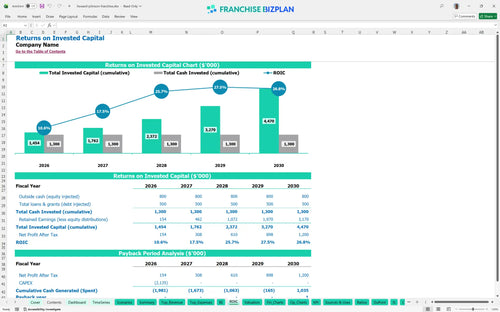
The ROI calculation for this hospitality investment yields an internal rate of return of 2.97% and a return on equity of 3.96%. When calculating return on investment for hotel property renovations, the model indicates a 5-year payback period based on the projected $1.84 million EBITDA by year five. Patience is a requirement in hotel equity.
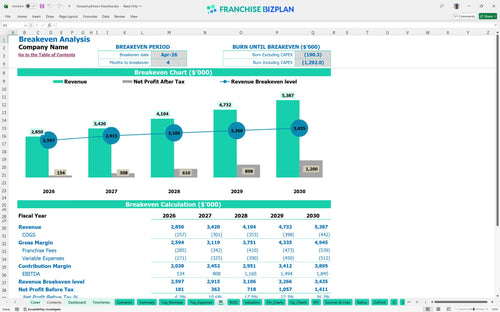
Using this Excel template for hotel franchise financial forecasting, the unit hits its monthly break-even point in April 2026, just four months after the initial investment phase. The primary driver for stability is the $1.2 million standard room revenue, which must cover the $35,000 monthly rent and fixed utilities. Volume solves most problems, but margin solves the rest.
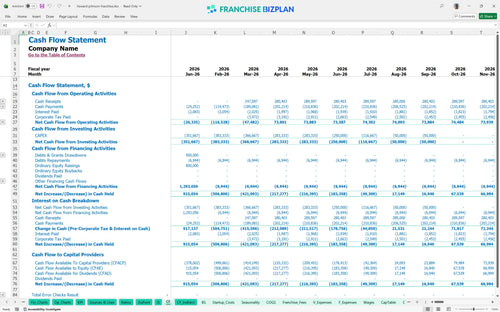
Your franchise unit budget and cash flow analysis spreadsheet identifies a minimum cash point of negative $679,000 in July 2026. This occurs during the final phase of suite upgrades, so you defintely need to secure a sufficient working capital line to bridge the gap until high-season revenue kicks in. The valley of death is usually six months post-launch.
This financial model for mid-scale hotel franchise demonstrates that a high-revenue scenario significantly shortens the payback period and boosts the year-one $534,000 EBITDA. Conversely, the low-case scenario highlights the risk of fixed costs like the $120,000 GM salary if occupancy falls below 60%. Hope is not a strategy; stress-testing is.
This franchise financial model template is a fully customizable Excel framework designed for the hospitality sector, featuring pre-filled formulas and editable assumptions. You can easily adjust the franchise profit and loss statement to match your specific highway location, local labor market, and seasonal demand shifts. Every cell is open for your specific site data.

Developing a hotel franchise business plan requires a clear view of the future, and this model provides a detailed 5-year franchise unit financial projection. It maps out the transition from initial launch to a mature operating state, showing how revenue scales from $2.85 million in year one to over $5.3 million by year five. Five years is the standard horizon for hospitality debt.

This tool simplifies analyzing hotel franchise ongoing royalty and marketing fees by applying a 5% royalty and 5% marketing fund contribution directly to your gross room sales. By integrating these franchise royalty fees into your franchise business model financial projections excel, you get a realistic view of the net cash available for debt service and owner distributions. Don't ignore the marketing fund; it's a non-negotiable tax on gross sales.

Planning for hospitality franchise startup costs involves more than just the $35,000 initial fee; it requires detailed capital expenditure planning for leasehold improvements and FF&E (Furniture, Fixtures, and Equipment). This model helps you identify the total capital needed to reach the April 2026 break-even point, ensuring you don't run out of runway during the renovation phase. Pre-opening costs can sink a project before the first guest checks in.

The model incorporates realistic hotel operational expenses, such as housekeeping supplies starting at 6% of revenue and declining as you gain scale. By comparing your projected labor costs and $35,000 monthly rent against these industry benchmarks, you can verify if your store-level margins are sustainable for a mid-scale property. Labor is your biggest variable lever.


Simply purchase and download the financial model template, then access it instantly using Microsoft Excel or Google Sheets. No installation or technical expertise required-just open and start working.

Enter your business-specific numbers, including revenue projections, costs, and investment details. The pre-built formulas will automatically calculate financial insights, saving you time and effort.

Leverage the investor-ready format to confidently showcase your financial projections to banks, franchise representatives, or investors. Impress stakeholders with clear, data-driven insights and professional reports.

Leverage the investor-ready format to confidently present your projections to banks, franchise representatives, or investors.