


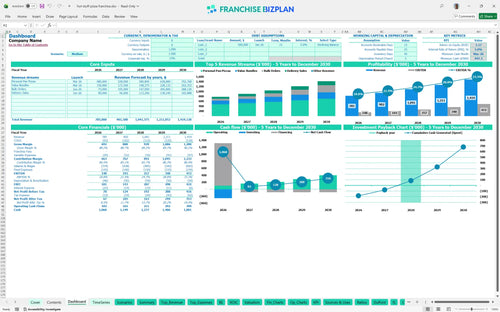
All-in-one Dashboard
Core inputs and core outputs



This franchise unit financial model for quick service restaurants includes a complete suite of pro-forma statements, CAPEX schedules, and automated break-even calculators to streamline your planning process.
Core inputs and core outputs
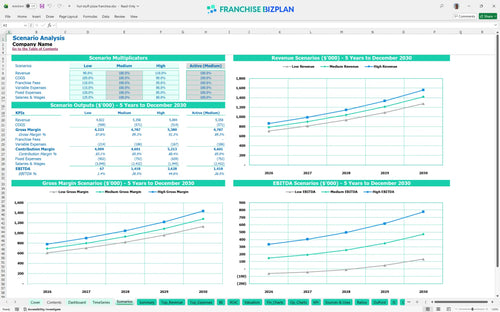
Three scenario analysis
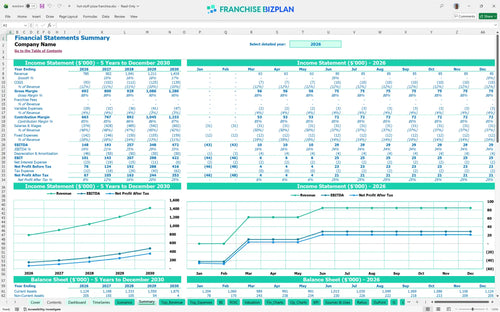
Presentation ready
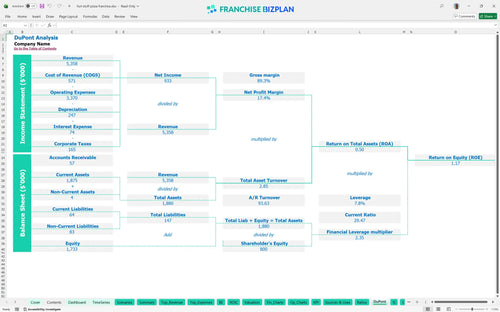
DuPont analysis
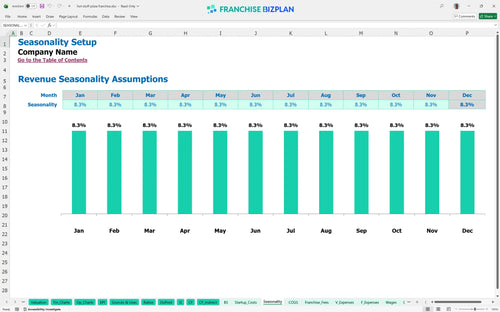
Researched revenue assumptions
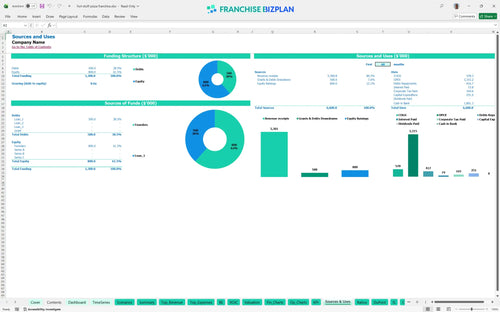
Lender-friendly financial outputs
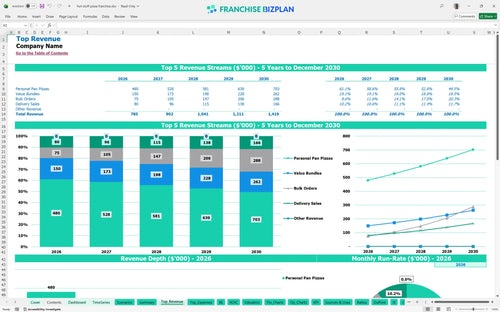
Revenue stream detailed view
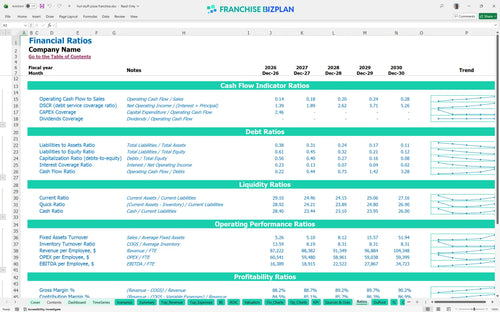
Performance metrics benchmark
We built this pizza franchise business plan model using our own research to ensure every assumption is grounded in reality. Key inputs for revenue streams, such as the $320,000 in Personal Pan Pizza sales, and the $251,000 initial investment are pre-populated and fully editable. This allows you to assess return on investment for food service franchises with confidence before committing capital.
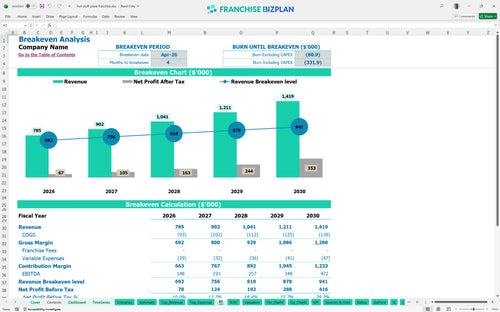
The unit hits its break-even date in April 2026, just four months after the March launch. With Year 1 EBITDA (earnings before interest, taxes, depreciation, and amortization) at $148,000, the model shows how to calculate pizza franchise profitability by scaling high-margin items like Value Bundles and Bulk Orders. Maintaining healthy franchise profit margins depends on keeping ingredient costs near the 10% target while managing a 24-hour labor schedule.
You need approximately $251,000 in capital expenditure planning to launch this unit. This total includes the $68,000 franchise fee, $80,000 for leasehold improvements, and $45,000 for specialized pizza ovens. The model also accounts for a minimum cash point of $947,000 in March 2026, which covers your initial investment plus the necessary working capital to handle the ramp-up period.
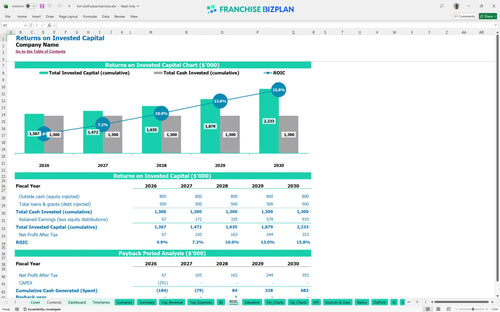
Franchisees can expect an Internal Rate of Return (IRR) of 5.03% and a Return on Equity (ROE) of 1.17. The payback period is 3 years, which is defintely a solid timeline for a convenience store food franchise. These metrics provide a clear picture of the long-term value created by the $785,000 in Year 1 revenue and the subsequent growth in EBITDA.
Monthly break-even occurs four months after launch, requiring enough volume to cover $11,800 in monthly fixed costs including rent and utilities. The primary driver for reaching this point is the Personal Pan Pizza line, which is projected to generate $320,000 in its first year. Managing overhead costs for 24-hour food service units is the key to hitting this milestone quickly.
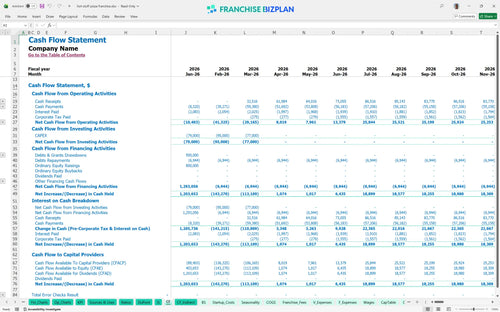
The lowest cash point occurs in March 2026 at $947,000, requiring a disciplined operational expenses analysis during the first 90 days. You need enough runway to cover the gap between the January franchise fee payment and the April break-even date. Still, the rapid 4-month path to profitability limits the long-term cash pressure if you manage opening inventory and staffing tightly.
Using an Excel template for restaurant franchise financial forecasting allows you to toggle between Low, Medium, and High cases to see how revenue shifts affect your IRR. A High scenario, driven by strong UTSA student demand and delivery sales, can significantly accelerate the $148,000 Year 1 EBITDA. Conversely, a Low case helps you identify the minimum traffic needed to keep the unit viable without additional capital infusions.
Finance: update unit break-even and payback model by Friday.
This franchise financial model template is built in Excel with fully editable assumptions and pre-filled formulas, allowing you to swap out any number to fit your specific territory. You can adjust everything from local labor rates to specific pizza pricing, making it easy to see how different operating scenarios impact your bottom line.

Long-term planning is essential for any QSR unit financial projection, and this model delivers a full 5-year outlook. It tracks revenue growth from $785,000 in Year 1 to over $1.4 million by Year 5, providing a clear roadmap for cash flow and long-term profitability. Use these revenue forecasting tools for pizza restaurant franchises to plan your multi-unit expansion strategy.

Managing your royalty fee structure is vital for maintaining store-level margins over time. This model captures the $68,000 initial franchise fee and provides dedicated slots for ongoing royalties and marketing fund contributions. It functions as a franchise investment calculator that ensures you never lose sight of your obligations to the brand.

Knowing your restaurant franchise startup costs is the first step toward a successful launch. This tool includes a detailed startup cost breakdown for convenience store food franchises, covering the $251,000 in initial CAPEX (capital expenditure). By analyzing break-even points for new franchise units, you can see exactly when your sales volume will cover your $11,800 in monthly fixed costs.

The model incorporates unit economics benchmarks to help you sanity-check your projections against industry standards. From the $7,000 monthly rent to the 10% pizza ingredient cost, these benchmarks ensure your financial feasibility study for new franchise locations is realistic. Comparing your expected performance to these ranges helps identify potential margin leaks before they happen.


Simply purchase and download the financial model template, then access it instantly using Microsoft Excel or Google Sheets. No installation or technical expertise required-just open and start working.

Enter your business-specific numbers, including revenue projections, costs, and investment details. The pre-built formulas will automatically calculate financial insights, saving you time and effort.

Leverage the investor-ready format to confidently showcase your financial projections to banks, franchise representatives, or investors. Impress stakeholders with clear, data-driven insights and professional reports.

Leverage the investor-ready format to confidently present your projections to banks, franchise representatives, or investors.