
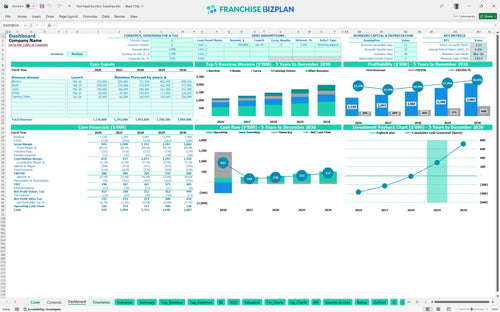
All-in-one Dashboard
Core inputs and core outputs


This comprehensive toolkit provides everything a prospective owner needs to evaluate franchise unit economics and capital expenditure forecasting with precision.
Core inputs and core outputs
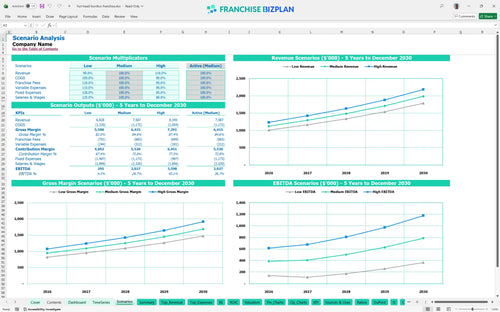
Three scenario analysis
Presentation ready
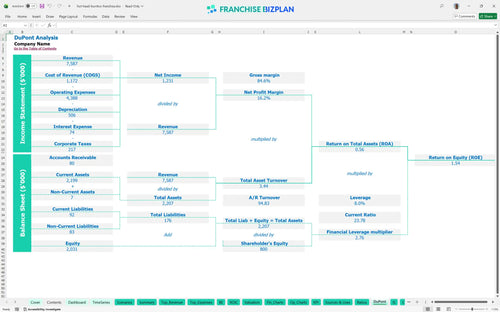
DuPont analysis
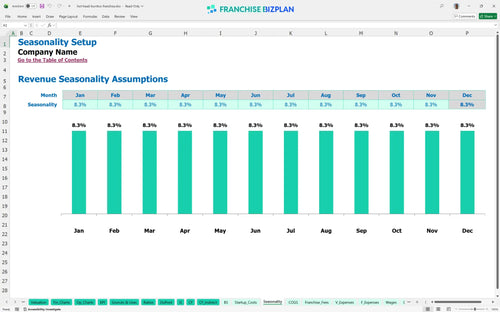
Researched revenue assumptions
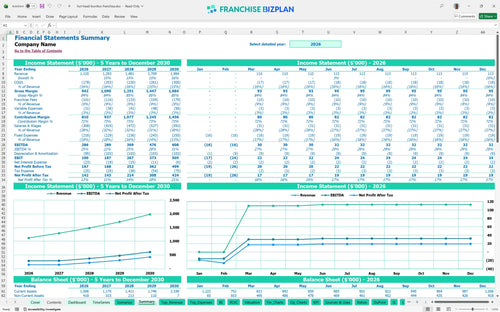
Lender-friendly financial outputs
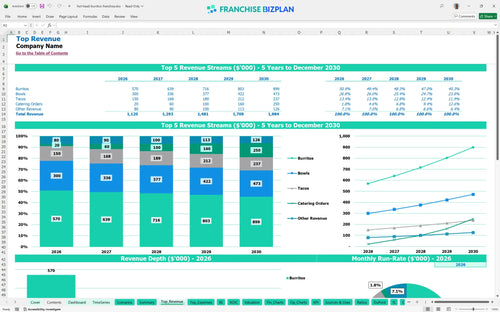
Revenue stream detailed view
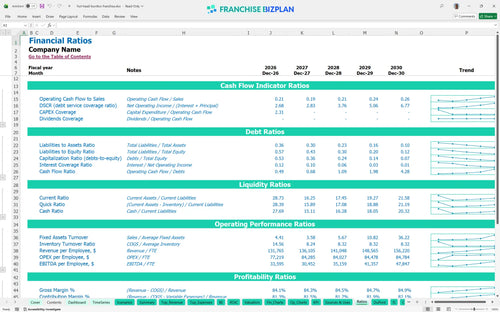
Performance metrics benchmark
We built this franchise unit financial model using our own research into the fast-casual sector. Key assumptions like the $1,120,000 Year 1 revenue and $13,500 monthly rent are pre-populated but fully editable to fit your local market. It is a practical guide for evaluating the profitability of a fast-casual burrito franchise without the guesswork.
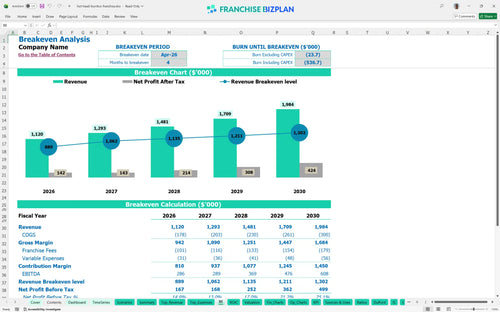
The unit hits profitability quickly, reaching its break-even date in April 2026, just four months after launching. By Year 1, you are looking at an EBITDA of $286,000, which scales to $608,000 by Year 5 as catering orders grow. Here is the quick math: high early volume is the key to surviving the ramp-up phase.
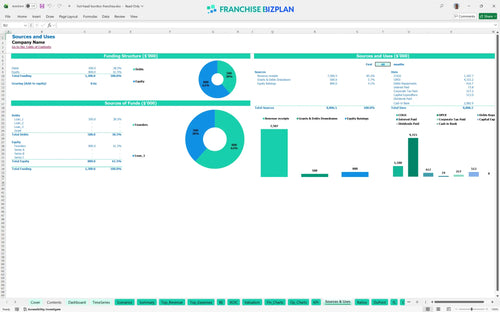
To launch this unit in the US, you need a total initial investment of roughly $513,000. This includes the $26,000 franchise fee and $280,000 for leasehold improvements, plus a cash buffer to handle the $742,000 minimum cash point during the first few months. Capital expenditure forecasting is the most critical part of your pre-opening phase.
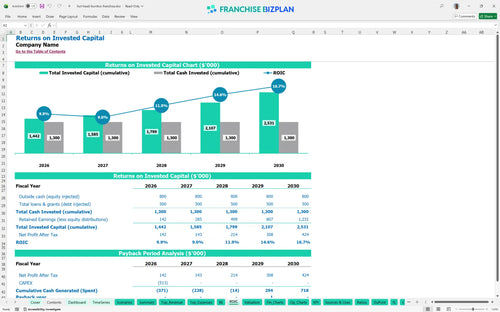
Franchisees can expect an Internal Rate of Return (IRR) of 4.35% and a Return on Equity (ROE) of 1.54. The payback period is 4 years, which is a solid timeline for a retail food franchise with significant equipment and build-out costs. This franchise investment return on investment calculator helps you see if the risk matches the reward.
The monthly break-even point is achieved in month 4, provided you hit the projected volume of burritos and bowls. The biggest hurdle is the $13,500 monthly rent, which is a fixed cost that requires high throughput to cover. Speed of service is defintely the most important factor for hitting these numbers early.
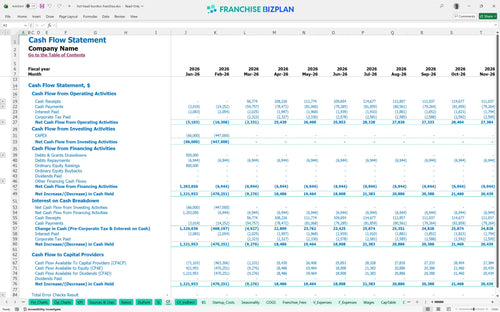
The lowest cash point occurs in March 2026 at $742,000, right as operations commence. You need to ensure you have enough working capital to cover the $13,500 rent and $2,100 utilities during the first 90 days of ramp-up. Best practices for restaurant franchise cash flow management suggest keeping a 3-month reserve at all times.
This financial model for multi-unit franchise operators allows you to test Low, Medium, and High scenarios. A High scenario sees revenue hitting $1,984,000 by Year 5, while the Low case shows how a 1-point margin leak in food ingredients (COGS) impacts your Year 1 EBITDA of $286,000. Detailed startup budget template for retail food franchises should always include these 'what-if' views.
Finance: update unit break-even and payback model by Friday
This franchise financial model template is built in Excel to give you total control over your numbers. You can swap out pre-filled formulas and edit assumptions to match your specific territory, whether you are looking at a high-traffic urban spot or a suburban strip mall. Honestly, a model is only as good as its inputs, so we made every revenue driver and cost line item easy to change. One size never fits all in the world of fast-casual dining.

Long-term planning is the difference between a hobby and a business, so this restaurant profit and loss template covers a full 60-month outlook. You can track how revenue grows from $1,120,000 in the first year to nearly $2,000,000 by year five. It maps out the transition from a fresh startup to a mature unit with stable cash flows. Success in franchising is a marathon, not a sprint.

Understanding your obligations to the franchisor is vital for protecting your store-level margin. This tool simplifies analyzing franchise royalty and marketing fees in Excel by calculating the 6% royalty and 3% marketing fund contributions automatically. It ensures you see the real impact of these off-the-top expenses before you ever sign a lease. Don't let the royalty fee structure surprise your bottom line.

This franchise startup cost calculator helps you visualize the total check you need to write before serving your first customer. It details everything from the $26,000 initial fee to the $280,000 build-out, giving you a clear break-even analysis. Knowing exactly when your daily sales cover your $13,500 monthly rent is the best way to sleep better at night. Knowing your numbers is the best way to manage risk.

We have included researched benchmarks to help you sanity-check your operating expenses. When estimating labor costs for quick service restaurants, you can compare your $65,000 manager salary and 14% food COGS (cost of goods sold) against industry standards. It is a reality check that keeps your projections grounded in what actually happens on the shop floor. Benchmarks keep your ego in check and your bank account full.


Simply purchase and download the financial model template, then access it instantly using Microsoft Excel or Google Sheets. No installation or technical expertise required-just open and start working.

Enter your business-specific numbers, including revenue projections, costs, and investment details. The pre-built formulas will automatically calculate financial insights, saving you time and effort.

Leverage the investor-ready format to confidently showcase your financial projections to banks, franchise representatives, or investors. Impress stakeholders with clear, data-driven insights and professional reports.

Leverage the investor-ready format to confidently present your projections to banks, franchise representatives, or investors.