
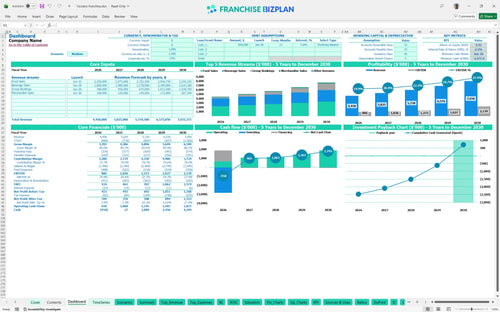
All-in-one Dashboard
Core inputs and core outputs


This Excel template for restaurant franchise financial projections includes a comprehensive pro forma, CAPEX scheduler, and detailed staffing plan.
Core inputs and core outputs
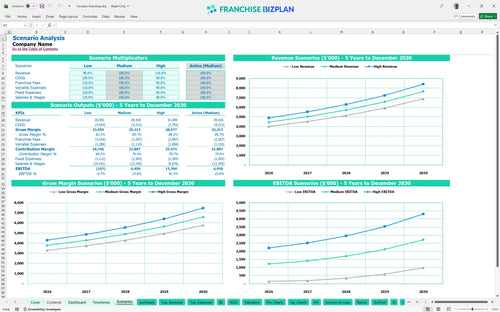
Three scenario analysis
Presentation ready
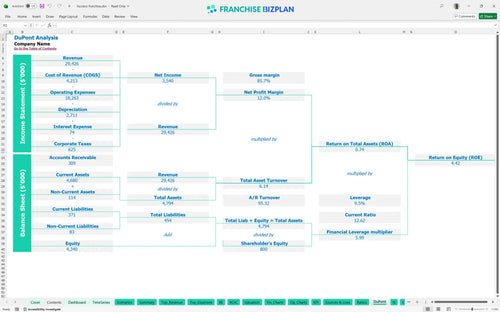
DuPont analysis
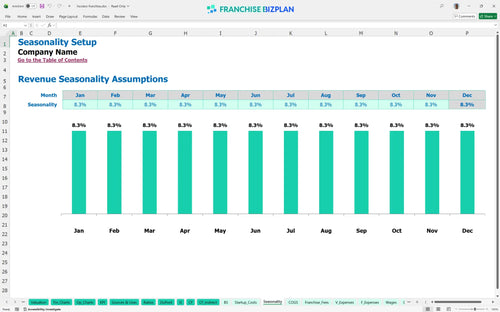
Researched revenue assumptions
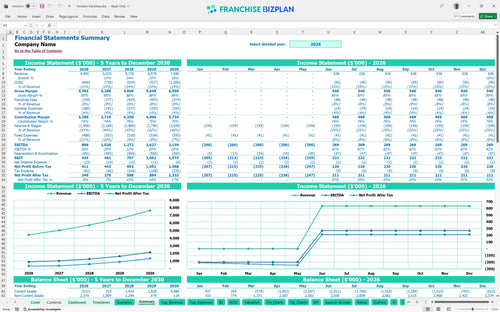
Lender-friendly financial outputs
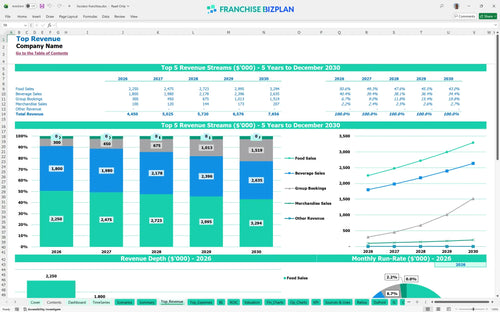
Revenue stream detailed view
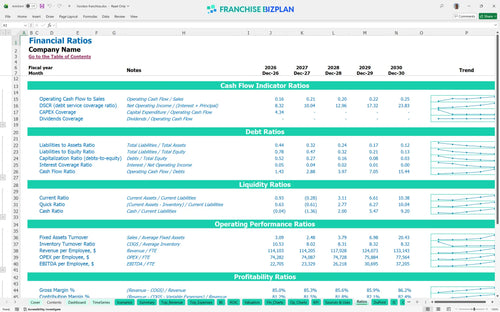
Performance metrics benchmark
We built this franchise unit financial model using our own research into high-volume sports bar operations. Key assumptions, including the $2.82 million initial investment and the 7.5% total brand fees, are pre-populated with data specific to a Hooters Franchise franchise unit and are fully editable. This tool helps you see how a unit generating $886,000 in first-year EBITDA handles a $28,000 monthly rent in a prime entertainment district.
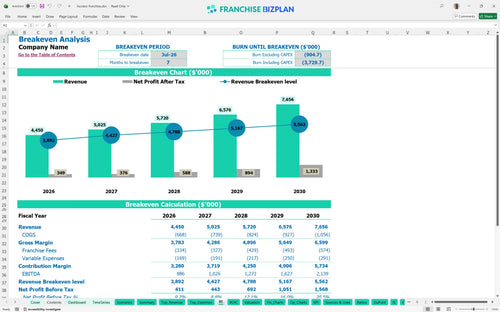
The unit is projected to reach monthly profitability by July 2026, roughly 7 months after the initial launch. This assumes you hit the $4.45 million year-one revenue target while maintaining a 15% combined COGS for food and beverages. Here is the quick math: your margin depends on keeping the 37 servers and 6 bartenders on a tight schedule during off-peak hours.
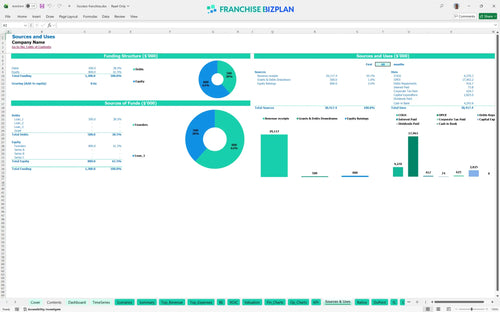
Launching this unit requires a total capital outlay of approximately $2.82 million, with the largest portion dedicated to leasehold improvements. You will defintely need to account for the $2.47 million minimum cash requirement during the build-out and initial ramp-up phase. This financial planning guide for restaurant franchise operators ensures you don't run dry before the doors open.
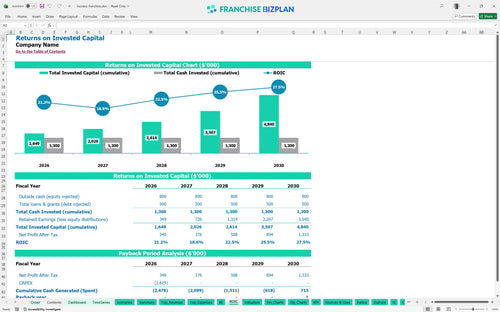
Investors can expect an Internal Rate of Return (IRR) of 2.54% and a 5-year payback period based on the current growth trajectory. While the initial investment is significant, the year-5 EBITDA of $2.13 million demonstrates the high-volume potential of this concept. Calculating ROI for a restaurant franchise unit is about balancing that heavy front-end CAPEX against long-term cash flow.
The monthly break-even point is reached in month 7, provided the unit maintains its trajectory toward $370,000 in average monthly sales. The primary driver for break-even is labor productivity, as the model carries a $1.65 million annual wage bill. Estimating operating expenses for a high-volume restaurant requires a close eye on these fixed management salaries and hourly staffing levels.
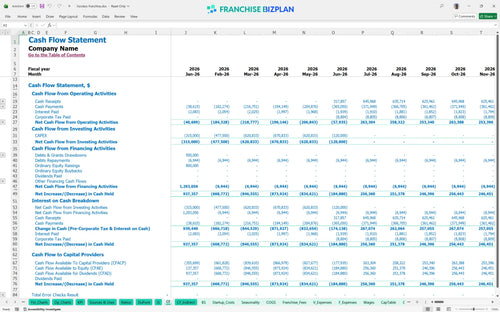
The lowest cash point occurs in June 2026, hitting a deficit of $2.47 million before revenue begins to offset the massive build-out costs. You need a robust cash buffer to survive the 5-month construction period where rent and insurance payments continue without sales. Still, once the doors open, the high average ticket helps rebuild the runway quickly.
The model compares Low, Medium, and High scenarios to show how a 10% shift in traffic impacts your 5-year payback. In the High scenario, aggressive group booking sales-projected to hit $1 million by year 5-can significantly improve the 2.54% IRR. This restaurant franchise investment analysis spreadsheet allows you to stress-test your assumptions before signing a lease.
This restaurant franchise financial model provides a flexible framework in Excel for testing different market scenarios. You can adjust pre-filled formulas and editable assumptions for labor, rent, and local COGS to match your specific territory. It is a practical tool for translating a complex business plan into a clear, spreadsheet-driven reality.

Planning for a high-volume unit requires a long-term view of cash flow and scale. This franchise unit financial template maps out a 5-year trajectory, showing revenue growing from $4.45 million in year one to over $7.6 million by year five. It provides the detailed profit and loss statement template needed to track the transition from startup to a mature, cash-flowing asset.

The model simplifies franchise royalty fee calculation by applying the 5% royalty and 2.5% marketing fund contributions directly to your gross sales forecast. By capturing these ongoing obligations alongside the initial $75,000 franchise fee, you get a transparent view of your store-level EBITDA. Every dollar of corporate overhead is accounted for before you see your bottom line.

Estimating how to calculate startup costs for a restaurant franchise is the first step in de-risking your investment. This model includes a $1.2 million leasehold improvement budget and $450,000 for kitchen equipment to ensure your capital expenditure planning is realistic. The break-even analysis template identifies the exact month when your high-capacity bar and food sales cover the $40,700 in monthly fixed costs.

This restaurant profitability analysis tool uses researched benchmarks to help you sanity-check your unit economics. With food COGS starting at 13.5% and labor models for over 40 staff members, you can compare your projected margins against industry standards for high-volume sports bars. It turns abstract goals into concrete operational targets for your management team.


Simply purchase and download the financial model template, then access it instantly using Microsoft Excel or Google Sheets. No installation or technical expertise required-just open and start working.

Enter your business-specific numbers, including revenue projections, costs, and investment details. The pre-built formulas will automatically calculate financial insights, saving you time and effort.

Leverage the investor-ready format to confidently showcase your financial projections to banks, franchise representatives, or investors. Impress stakeholders with clear, data-driven insights and professional reports.

Leverage the investor-ready format to confidently present your projections to banks, franchise representatives, or investors.