
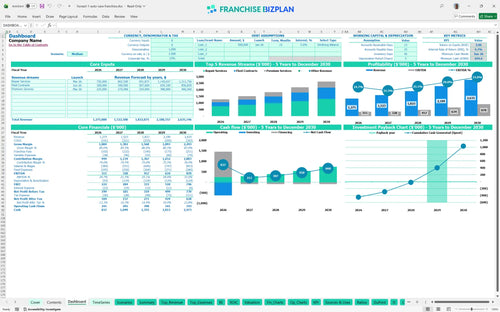
All-in-one Dashboard
Core inputs and core outputs


This Excel template for franchise unit financial projections provides a complete roadmap for launching and scaling a professional auto repair center with pre-built logic for every major expense.
Core inputs and core outputs
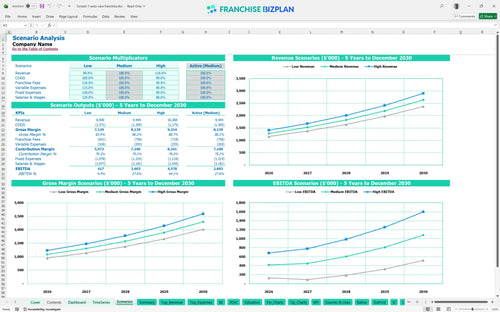
Three scenario analysis
Presentation ready
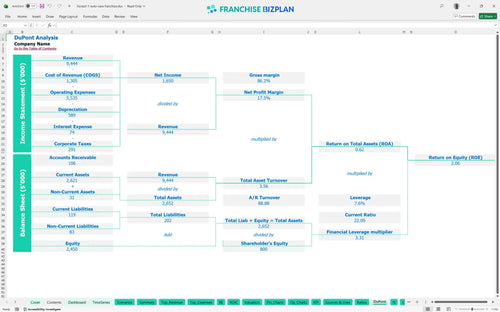
DuPont analysis
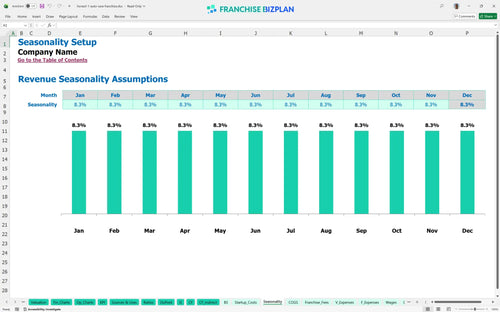
Researched revenue assumptions
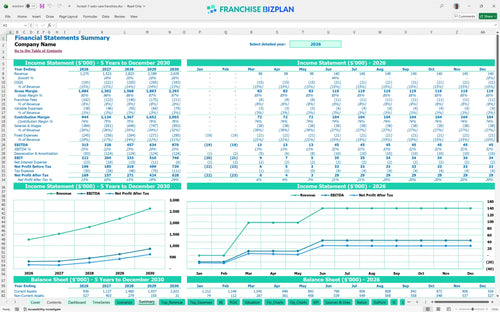
Lender-friendly financial outputs
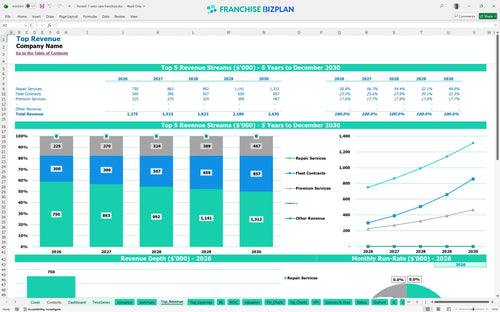
Revenue stream detailed view
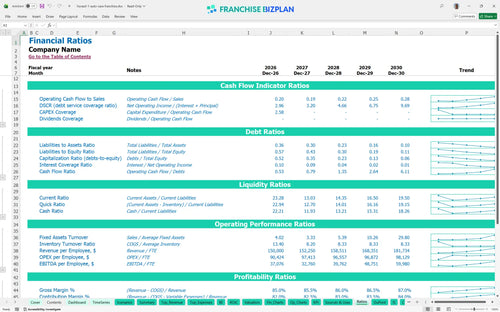
Performance metrics benchmark
We built this franchise unit financial model using our own research into the automotive repair sector. Key assumptions, including the $1.27 million year-one revenue target and the 6% royalty fee, are pre-populated with researched data but remain fully editable. This tool helps you see how a $315,000 initial EBITDA can grow as you scale your technician count and fleet contracts.
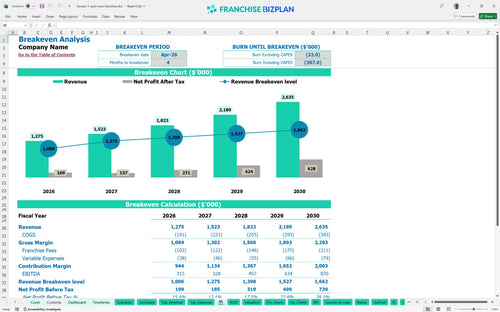
The shop reaches profitability very quickly, hitting its break-even point in April 2026, just four months after opening. This assumes you hit your year-one revenue target of $1.27 million while managing a 6% royalty and 2% marketing fee. Here's the quick math: with EBITDA starting at $315,000, you are cash-flow positive almost from the jump.
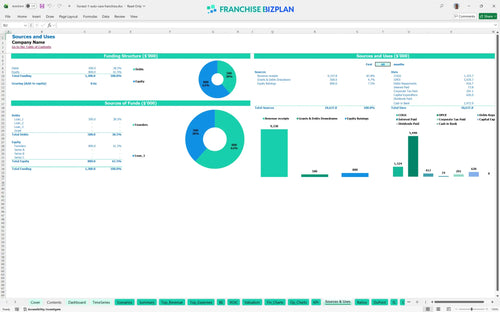
Launching this unit requires a significant automotive franchise investment breakdown, totaling over $650,000 in major capital items. This includes your $75,000 franchise fee, $200,000 for leasehold improvements, and $120,000 for automotive lifts. You also need to budget for diagnostic equipment and tools to meet brand standards before the first car pulls in.
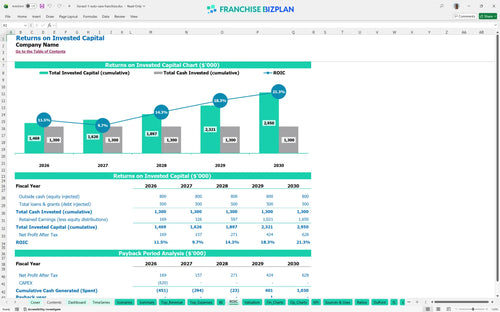
Investors can expect an internal rate of return (IRR) of 4.7% and a return on equity (ROE) of 2.06 based on the 5-year forecast. The payback period is 4 years, meaning you recover your initial investment through shop cash flow by the end of the fourth year. These metrics assume revenue grows to $2.6 million as you add more technicians to the bays.
Your monthly break-even depends heavily on covering the $12,000 rent and the $135,000 combined annual salary for your store and service managers. The model shows you hit this point in month 4, provided your service advisors maintain a steady average ticket. If labor costs spike or parts margins dip below 12%, that break-even date will defintely slide further out.
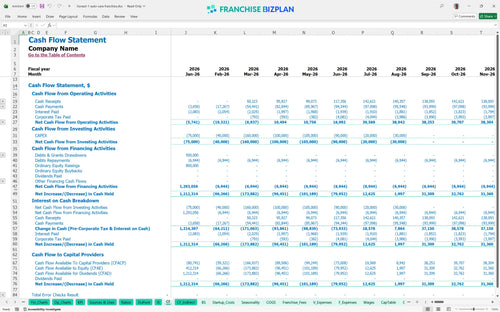
The lowest cash point for the shop is $695,000 in June 2026, which marks the end of the heavy ramp-up and equipment spend. You need enough runway to cover the $2,200 monthly utility bills and insurance before the fleet contracts fully kick in. What this estimate hides is the potential for leasehold delays, so keeping a cash buffer is realy important.
In the high scenario, revenue hits $2.6 million by year five, which more than doubles your year-one EBITDA from $315,000 to $870,000. The low scenario shows that if technician productivity lags, your year-one margin gets squeezed by the fixed $12,000 rent. Still, even a medium-performance shop shows a path to a 4-year payback if you keep a lid on variable costs.
This franchise financial model is built in Excel to give you total control over your numbers. All formulas are unlocked and assumptions are editable, so you can easily adjust the auto repair shop business plan to fit your specific market or lease terms. It is a flexible tool designed for real-world operators who need to move beyond static spreadsheets.

Planning for the long haul is the only way to survive in the automotive space. This model provides 5-year revenue forecasting and cash flow views, showing how your shop scales from $1.27 million in year one to over $2.6 million by year five. It maps out the path from a new shop to a mature, high-performing asset with clear profit and loss visibility.

Operating a branded shop means managing specific overhead like the 6% royalty and 2% marketing fund contributions. This model tracks these franchise startup costs and ongoing obligations automatically based on your sales volume. It ensures you understand exactly how much cash stays in the shop and how much goes to the franchisor every month.

Knowing your numbers starts with estimating the total initial investment, including the $75,000 franchise fee and equipment costs. This tool includes a detailed break-even analysis to show you the exact sales volume needed to cover your $12,000 monthly rent and labor. It simplifies the process of analyzing break-even point for automotive franchise units before you sign a lease.

We have included industry-standard benchmarks for labor, parts, and occupancy to help you sanity-check your unit economics. If your technician wages or shop consumables are out of line with typical ranges, the model highlights the gap. This helps you build a more realistic financial feasibility study for automotive franchises by using data-driven guardrails.


Simply purchase and download the financial model template, then access it instantly using Microsoft Excel or Google Sheets. No installation or technical expertise required-just open and start working.

Enter your business-specific numbers, including revenue projections, costs, and investment details. The pre-built formulas will automatically calculate financial insights, saving you time and effort.

Leverage the investor-ready format to confidently showcase your financial projections to banks, franchise representatives, or investors. Impress stakeholders with clear, data-driven insights and professional reports.

Leverage the investor-ready format to confidently present your projections to banks, franchise representatives, or investors.