
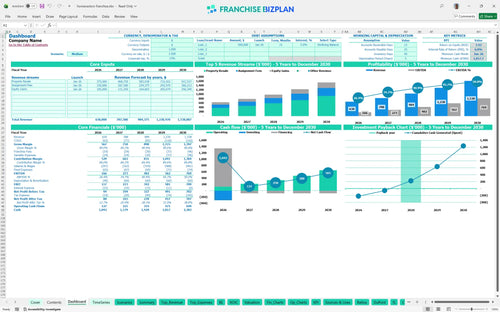
All-in-one Dashboard
Core inputs and core outputs


This real estate flipping franchise financial projections template provides a comprehensive toolkit for forecasting property flips, wholesale assignments, and long-term equity gains with integrated payroll and CAPEX tracking.
Core inputs and core outputs
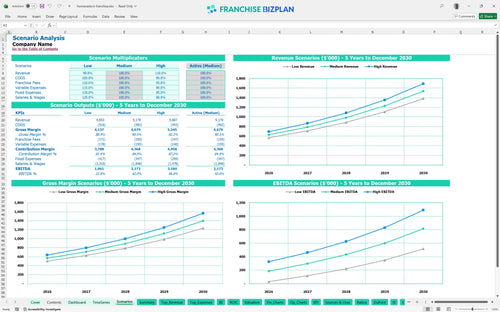
Three scenario analysis
Presentation ready
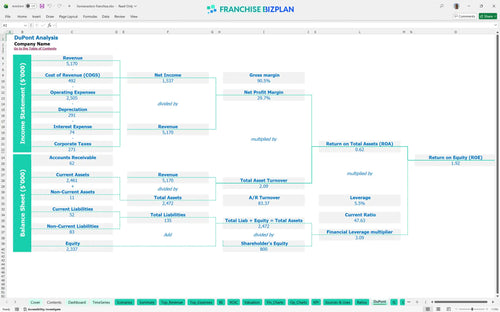
DuPont analysis
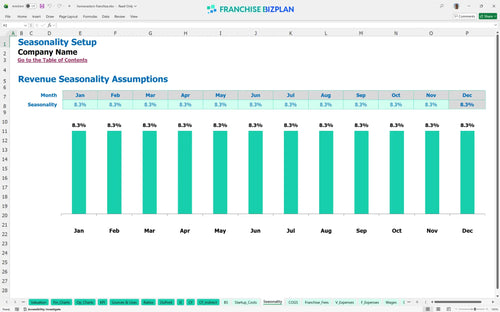
Researched revenue assumptions
Lender-friendly financial outputs
Revenue stream detailed view
Performance metrics benchmark
We built this franchise unit financial model using our own research to provide a clear property investment business plan. Key assumptions, including the $630,000 year-one revenue and 3% royalty fees, are pre-populated with researched data and are fully editable to match your specific market. This tool ensures your franchise unit economic analysis is grounded in reality rather than guesswork.
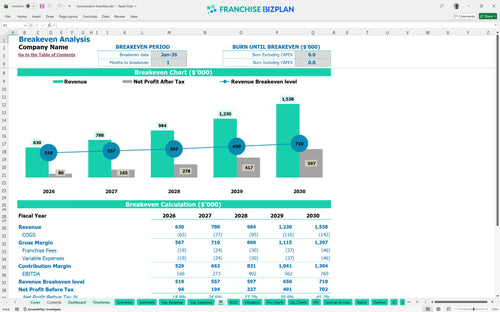
You can expect this unit to hit profitability almost immediately, with a break-even date of January 2026. By the end of the first year, EBITDA (earnings before interest, taxes, depreciation, and amortization) should reach $166,000, scaling significantly as you refine your property acquisition and resale volume to hit $769,000 by year five.
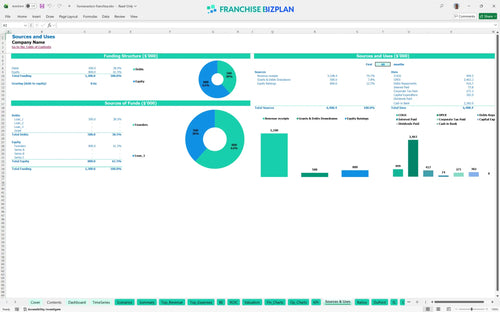
Launching this unit requires $302,000 in initial capital to cover the franchise fee and essential infrastructure. Most of this goes toward the $85,000 entry fee and $75,000 for office leasehold improvements to establish your local presence, plus $40,000 for a company vehicle to handle site visits.
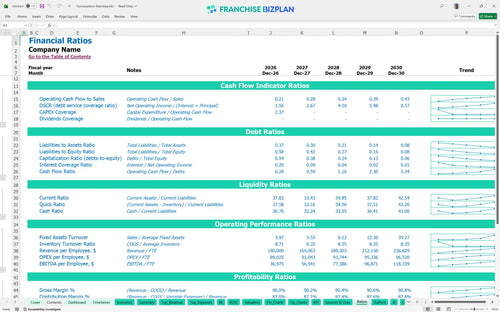
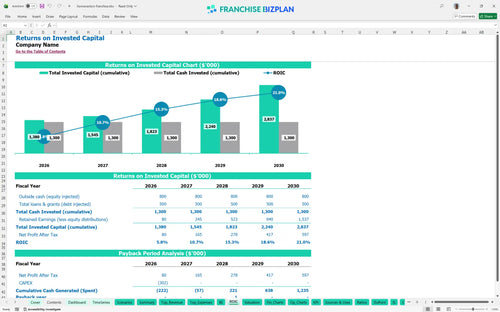
The investment property cash flow model projects an Internal Rate of Return (IRR) of 6.75% with a full payback period of 3 years. With a Return on Equity (ROE) of 1.92, the model shows steady growth as equity gains and resale profits compound over the five-year period, making it a stable real estate investment ROI play.
You reach the break-even point in just one month, specifically January 2026, provided you hit your initial property resale targets. The biggest lever here is your acquisition volume; if you miss your first few deals, the fixed costs like the $3,500 monthly rent and $23,333 monthly payroll will eat your cash fast, so you need to move quickly.
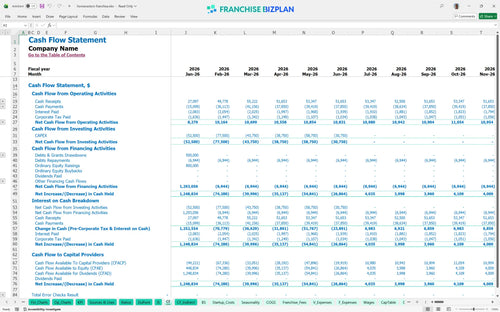
Your lowest cash point is projected for June 2026 at $1,018,000, assuming you maintain a significant cash buffer for property purchases. To keep the runway clear, you need to manage the timing between renovation spend and final closing closely, as any delay in a $250,000 resale can spike your working capital pressure.
Moving from a medium to a high-growth scenario can push your year-5 EBITDA from $769,000 toward much higher levels if you scale your marketing specialist's impact. In a low case, property acquisition costs might rise above the 7% baseline, which defintely puts pressure on your net margins and extends the payback period beyond the 3-year mark.
This real estate franchise financial model is built entirely in Excel, giving you the freedom to adjust every variable to your specific market conditions. It features pre-filled formulas and editable assumptions for property flipping and wholesale fees, so you can easily adapt the logic to your territory and local renovation costs.

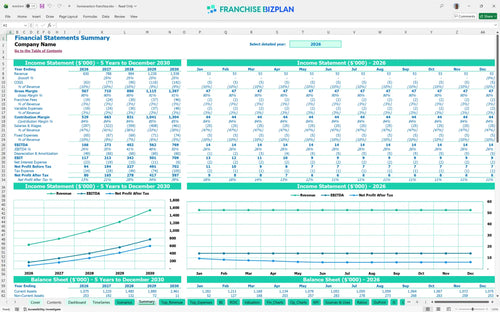
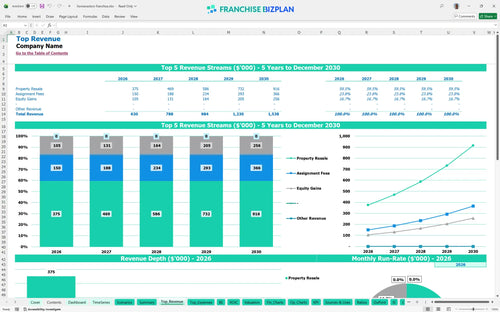
Map out your path from a single territory to a multi-unit powerhouse with detailed 5-year projections. The model tracks revenue scaling from $630,000 in year one to over $1.5 million by year five, providing a clear property investment business plan that visualizes cash flow and long-term profitability for your real estate flipping franchise model.

Managing the 3% royalty fee is built right into the logic, ensuring you see the true store-level margin after all obligations. It accounts for the $85,000 initial fee and ongoing brand contributions so you can understand the real economics of operating the unit without any hidden surprises.

Calculate your total franchise startup costs template needs, including the $302,000 in initial CAPEX for office build-outs, vehicles, and data software. The model identifies exactly when you hit the break-even point, which is critical for managing your early-stage runway and ensuring you have enough working capital to close your first deals.

We've baked in industry standards for labor and rent to help you sanity-check your numbers against typical real estate investment franchise operational costs. If your renovation costs (3%) or acquisition percentages (7%) drift too far from the norm, the model flags it so you can adjust your strategy and maintain healthy store-level margins.


Simply purchase and download the financial model template, then access it instantly using Microsoft Excel or Google Sheets. No installation or technical expertise required-just open and start working.

Enter your business-specific numbers, including revenue projections, costs, and investment details. The pre-built formulas will automatically calculate financial insights, saving you time and effort.

Leverage the investor-ready format to confidently showcase your financial projections to banks, franchise representatives, or investors. Impress stakeholders with clear, data-driven insights and professional reports.

Leverage the investor-ready format to confidently present your projections to banks, franchise representatives, or investors.